easyclimate.plot.mpas
Convenience imports for the mpas_plot package.
Submodules
- easyclimate.plot.mpas.cell_barbs
- easyclimate.plot.mpas.cell_contour
- easyclimate.plot.mpas.cell_curved_quiver
- easyclimate.plot.mpas.cell_quiver
- easyclimate.plot.mpas.cell_streamplot
- easyclimate.plot.mpas.cell_voronoi
- easyclimate.plot.mpas.common
- easyclimate.plot.mpas.vertex_contour
- easyclimate.plot.mpas.vertex_voronoi
- easyclimate.plot.mpas.voronoi_extract
- easyclimate.plot.mpas.voronoi_grid
Functions
|
Plot MPAS cell-centered scalar field on native polygon cells. |
|
Plot MPAS Voronoi mesh edges. |
|
Extract and wrap MPAS cell and vertex lon/lat. |
|
Draw contour lines for MPAS cell-centered scalar field. |
|
Draw filled contour for MPAS cell-centered scalar field. |
|
Plot MPAS vertex-centered scalar data on dual polygons. |
|
Draw contour lines for MPAS vertex-centered scalar field. |
|
Draw filled contour for MPAS vertex-centered scalar field. |
|
Plot cell-centered vector wind on MPAS mesh. |
Plot MPAS cell-centered vector wind as curved quiver trajectories. |
|
|
Plot cell-centered vector wind as wind barbs on an MPAS mesh. |
|
Plot cell-centered vector wind as streamlines on an MPAS mesh. |
Package Contents
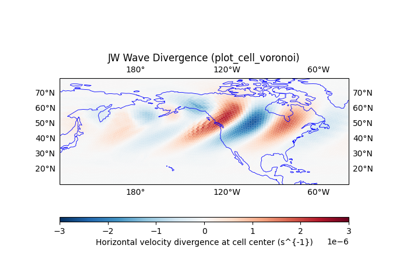
- easyclimate.plot.mpas.plot_cell_voronoi(ds, da, *, ax=None, transform=None, lon_min=None, lon_max=None, lat_min=None, lat_max=None, auto_extent=True, extent_margin=0.05, cell_margin=0.05, global_plot=False, input_radians=True, center_lon=None, skip_large_lon_jump=True, max_polygon_lon_span=180.0, cmap=None, vmin=None, vmax=None, symmetric=False, percentile=98, edgecolor='none', linewidth=0.0, add_colorbar=True, cbar_kwargs=None, title=None, xlabel='Longitude', ylabel='Latitude', aspect='auto', lon_name_cell='lonCell', lat_name_cell='latCell', lon_name_vertex='lonVertex', lat_name_vertex='latVertex', vertices_on_cell_name='verticesOnCell', n_edges_on_cell_name='nEdgesOnCell', use_geometry_cache=True)
Plot MPAS cell-centered scalar field on native polygon cells.
The scalar field is rendered on each native MPAS cell polygon. The function works with both plain Matplotlib axes and Cartopy GeoAxes.
Parameters
- ds
xarray.Dataset Dataset containing MPAS mesh geometry.
- da
xarray.DataArrayornumpy.ndarray Cell-centered scalar field. Must be 1D on nCells after selection.
- ax
matplotlib.axes.Axes, optional Axes on which to draw. By default, use the current axes.
- projection
cartopy.crs.CRS, optional Reserved for compatibility with older call sites.
- transform
cartopy.crs.CRS, optional Coordinate reference system of the input coordinates for Cartopy axes.
- lon_min, lon_max, lat_min, lat_max
float, optional Plot extent. Cross-dateline windows are supported, for example:
lon_min=-190, lon_max=-60describes the continuous longitude window from 170E to 60W.- auto_extent
bool, default: True If True and no explicit extent is supplied, infer the extent from valid cell centers.
- extent_margin
float, default: 0.05 Fractional margin added to the automatically inferred extent.
- cell_margin
float, default: 0.05 Extra fraction of the plot extent used to select cells outside the visible window. This helps avoid missing partial cells along boundaries.
- global_plot
bool, default: False If True, draw a global extent centered on
center_lon.- input_radians
bool, default: True If True, MPAS longitude and latitude variables are interpreted as radians and converted to degrees.
- center_lon
float, optional Longitude wrapping center. If None, inferred from lon_min/lon_max or valid cell centers.
- skip_large_lon_jump
bool, default: True If True, skip polygons with very large wrapped longitude spans.
- max_polygon_lon_span
float, default: 180.0 Maximum accepted wrapped polygon longitude span in degrees.
- cmap
strormatplotlib.colors.Colormap, optional Colormap used for cell values.
- vmin, vmax
float, optional Color limits. If omitted, infer them from selected values.
- symmetric
bool, default: False If True, infer symmetric color limits around zero.
- percentile
float, default: 98 Percentile used for automatic color-limit inference.
- edgecolor, linewidth
Polygon edge style passed to
matplotlib.collections.PolyCollection.- add_colorbar
bool, default: True If True, add a colorbar for the polygon collection.
- cbar_kwargs
dict, optional Keyword arguments passed to
Figure.colorbar.- title
str, optional Axes title. If None, use the data long name.
- figsize(
float,float), default: (8, 6) Reserved for compatibility with older call sites.
- xlabel, ylabel
str Axis labels used for plain Matplotlib axes.
- aspect
strorfloat, default: “auto” Aspect setting used for plain Matplotlib axes.
- lon_name_cell, lat_name_cell, lon_name_vertex, lat_name_vertex
str MPAS coordinate variable names.
- vertices_on_cell_name, n_edges_on_cell_name
str MPAS connectivity variable names.
- use_geometry_cache
bool, default: True If True, cache native cell polygon geometry for repeated calls.
Returns
- ax
matplotlib.axes.Axes Axes containing the plot.
- pc
matplotlib.collections.PolyCollection Polygon collection added to the axes.
- ds
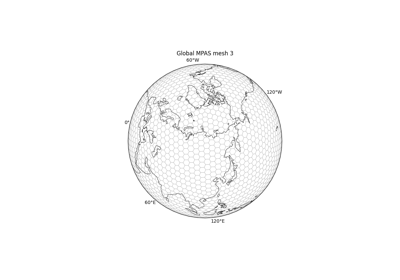
- easyclimate.plot.mpas.plot_voronoi_grid(data, verticesOnEdge='verticesOnEdge', lonVertex='lonVertex', latVertex='latVertex', lon_min=None, lon_max=None, lat_min=None, lat_max=None, ax=None, **linekwags)
Plot MPAS Voronoi mesh edges.
Parameters
- data
xarray.Dataset MPAS dataset containing
verticesOnEdge,lonVertex, andlatVertex. Used as the fallback source when these variables are not provided explicitly.- verticesOnEdge
str, optional Name of the edge-to-vertex connectivity variable using MPAS 1-based vertex indices.
- lonVertex, latVertex
str, optional Names of the vertex longitude and latitude variables in radians.
- lon_min, lon_max, lat_min, lat_max
float, optional Optional subset window in degrees. Cross-dateline longitude windows are supported.
- ax
matplotlib.axes.Axes, optional Axes on which to draw. By default, use the current axes.
- **linekwags
Additional keyword arguments passed to
matplotlib.collections.LineCollection.
Returns
matplotlib.collections.LineCollectionLine collection containing selected Voronoi mesh edges.
- data
- easyclimate.plot.mpas.extract_cell_latlon(ds, *, da=None, lon_min=None, lon_max=None, lat_min=None, lat_max=None, auto_extent=True, extent_margin=0.05, global_plot=False, center_lon=None, input_radians=True, lon_name_cell='lonCell', lat_name_cell='latCell', lon_name_vertex='lonVertex', lat_name_vertex='latVertex')
Extract and wrap MPAS cell and vertex lon/lat.
Parameters
- ds
xarray.Dataset MPAS dataset containing cell and vertex coordinate variables.
- da
xarray.DataArrayornumpy.ndarray, optional Cell-centered data. If provided, finite values are used for extent inference and
center_loninference.- lon_min, lon_max, lat_min, lat_max
float, optional User-defined plotting window. Supports cross-dateline windows, e.g.
lon_min=90, lon_max=-60means 90E to 300E.- auto_extent
bool, default: True If True and no explicit extent is supplied, infer the extent from valid cell centers.
- extent_margin
float, default: 0.05 Fractional margin added to the automatically inferred extent.
- global_plot
bool, default: False If True, return a global extent centered on
center_lon.- center_lon
float, optional Longitude wrapping center. If None, inferred automatically.
- input_radians
bool, default: True If True, MPAS longitude and latitude variables are interpreted as radians and converted to degrees.
- lon_name_cell, lat_name_cell, lon_name_vertex, lat_name_vertex
str MPAS coordinate variable names.
Returns
- dict
Dictionary with wrapped cell and vertex coordinates, the inferred longitude center, and plotting extent values.
- ds
- easyclimate.plot.mpas.plot_cell_contour(ds, da, *, ax=None, lon_min=None, lon_max=None, lat_min=None, lat_max=None, auto_extent=True, extent_margin=0.05, contour_margin=0.05, global_plot=False, center_lon=None, levels=10, colors=None, linewidths=0.8, linestyles=None, cmap=None, vmin=None, vmax=None, symmetric=False, percentile=98, extend=None, max_triangle_edge=None, input_radians=True, transform=None, title=None, lon_name_cell='lonCell', lat_name_cell='latCell', lon_name_vertex='lonVertex', lat_name_vertex='latVertex', use_triangulation_cache=True)
Draw contour lines for MPAS cell-centered scalar field.
Labels are not added automatically. Add them outside this function with
ax.clabel(cs, inline=True, fontsize=8, fmt="%g").Parameters
- ds
xarray.Dataset MPAS dataset containing cell and vertex coordinate variables.
- da
xarray.DataArrayornumpy.ndarray Cell-centered scalar values. The data must be one-dimensional on
nCellsafter any time or vertical-level selection.- ax
matplotlib.axes.Axes, optional Axes on which to draw. By default, use the current axes.
- lon_min, lon_max, lat_min, lat_max
float, optional Plot extent in degrees. Cross-dateline longitude windows are supported.
- auto_extent
bool, default: True If True and no explicit extent is supplied, infer the extent from valid cell centers.
- extent_margin
float, default: 0.05 Fractional margin added to the automatically inferred extent.
- contour_margin
float, default: 0.05 Fractional padding used when selecting source cells for contouring.
- global_plot
bool, default: False If True, draw a global extent centered on
center_lon.- center_lon
float, optional Longitude center used for wrapping. If None, infer it from the extent or valid cell centers.
- levels
intor array-like, default: 10 Number of contour levels, or explicit level values.
- colorscolor or
collections.abc.Sequenceof colors, optional Fixed line colors passed to
Axes.tricontour. If omitted, usecmap.- linewidths, linestyles
Contour line style options passed to
Axes.tricontour.- cmap
strormatplotlib.colors.Colormap, optional Colormap used when
colorsis not supplied.- vmin, vmax
float, optional Data limits used by contour levels and color mapping.
- symmetric
bool, default: False If True, infer symmetric limits around zero when
vminorvmaxis omitted.- percentile
float, default: 98 Percentile used for automatic data-limit inference.
- extend{“neither”, “both”, “min”, “max”}, optional
Contour extension mode. If None, infer it from data and levels.
- max_triangle_edge
float, optional Maximum accepted edge length for triangles. Longer triangles are masked.
- input_radians
bool, default: True If True, MPAS longitude and latitude variables are interpreted as radians and converted to degrees.
- transform
cartopy.crs.CRS, optional Coordinate reference system of the input coordinates for Cartopy axes.
- title
str, optional Axes title. If None, use the data long name.
- lon_name_cell, lat_name_cell, lon_name_vertex, lat_name_vertex
str MPAS coordinate variable names.
- use_triangulation_cache
bool, default: True If True, cache the triangulation for repeated calls on the same mesh and extent.
Returns
matplotlib.contour.QuadContourSetContour set returned by
Axes.tricontour.
- ds
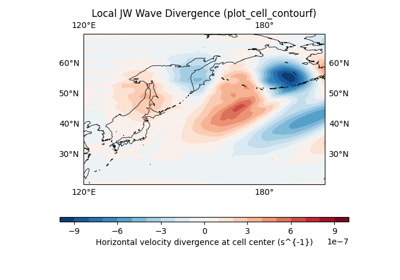
- easyclimate.plot.mpas.plot_cell_contourf(ds, da, *, ax=None, lon_min=None, lon_max=None, lat_min=None, lat_max=None, auto_extent=True, extent_margin=0.05, contour_margin=0.05, global_plot=False, center_lon=None, levels=10, cmap=None, vmin=None, vmax=None, symmetric=False, percentile=98, extend=None, max_triangle_edge=None, input_radians=True, transform=None, add_colorbar=True, cbar_kwargs=None, title=None, lon_name_cell='lonCell', lat_name_cell='latCell', lon_name_vertex='lonVertex', lat_name_vertex='latVertex', use_triangulation_cache=True)
Draw filled contour for MPAS cell-centered scalar field.
The scalar values are drawn from MPAS cell centers using
matplotlib.tri.Triangulation.Parameters
- ds
xarray.Dataset MPAS dataset containing cell and vertex coordinate variables.
- da
xarray.DataArrayornumpy.ndarray Cell-centered scalar values. The data must be one-dimensional on
nCellsafter any time or vertical-level selection.- ax
matplotlib.axes.Axes, optional Axes on which to draw. By default, use the current axes.
- lon_min, lon_max, lat_min, lat_max
float, optional Plot extent in degrees. Cross-dateline longitude windows are supported.
- auto_extent
bool, default: True If True and no explicit extent is supplied, infer the extent from valid cell centers.
- extent_margin
float, default: 0.05 Fractional margin added to the automatically inferred extent.
- contour_margin
float, default: 0.05 Fractional padding used when selecting source cells for contouring.
- global_plot
bool, default: False If True, draw a global extent centered on
center_lon.- center_lon
float, optional Longitude center used for wrapping. If None, infer it from the extent or valid cell centers.
- levels
intor array-like, default: 10 Number of contour levels, or explicit level values.
- cmap
strormatplotlib.colors.Colormap, optional Colormap used for filled contours.
- vmin, vmax
float, optional Color/data limits used by contour levels and color mapping. If one side is omitted, infer it from selected finite values.
- symmetric
bool, default: False If True, infer symmetric limits around zero when
vminorvmaxis omitted.- percentile
float, default: 98 Percentile used for automatic color-limit inference.
- extend{“neither”, “both”, “min”, “max”}, optional
Colorbar extension mode. If None, infer it from data and levels.
- max_triangle_edge
float, optional Maximum accepted edge length for triangles. Longer triangles are masked.
- input_radians
bool, default: True If True, MPAS longitude and latitude variables are interpreted as radians and converted to degrees.
- transform
cartopy.crs.CRS, optional Coordinate reference system of the input coordinates for Cartopy axes.
- add_colorbar
bool, default: True If True, add a colorbar for the filled contour set.
- cbar_kwargs
dict, optional Keyword arguments passed to
Figure.colorbar.- title
str, optional Axes title. If None, use the data long name.
- lon_name_cell, lat_name_cell, lon_name_vertex, lat_name_vertex
str MPAS coordinate variable names.
- use_triangulation_cache
bool, default: True If True, cache the triangulation for repeated calls on the same mesh and extent.
Returns
matplotlib.contour.QuadContourSetFilled contour set returned by
Axes.tricontourf.
- ds
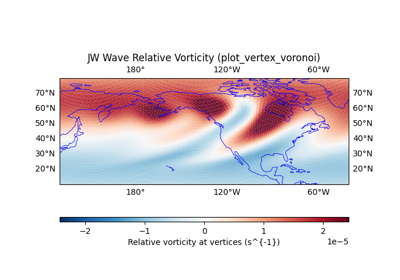
- easyclimate.plot.mpas.plot_vertex_voronoi(ds, da, *, ax=None, transform=None, lon_min=None, lon_max=None, lat_min=None, lat_max=None, auto_extent=True, extent_margin=0.05, vertex_margin=0.05, global_plot=False, center_lon=None, input_radians=True, skip_large_lon_jump=True, max_polygon_lon_span=180.0, cmap=None, vmin=None, vmax=None, symmetric=None, percentile=98, edgecolor='none', linewidth=0.0, add_colorbar=True, cbar_kwargs=None, title=None, xlabel='Longitude', ylabel='Latitude', aspect='auto', cells_on_vertex_name='cellsOnVertex', lon_name_cell='lonCell', lat_name_cell='latCell', lon_name_vertex='lonVertex', lat_name_vertex='latVertex', use_geometry_cache=True)
Plot MPAS vertex-centered scalar data on dual polygons.
Each vertex value is drawn on the dual polygon formed by the surrounding cell centers. If
dais cell-centered with lengthnCells, values are first averaged to vertices usingcellsOnVertex.Parameters
- ds
xarray.Dataset MPAS dataset containing vertex, cell, and connectivity variables.
- da
xarray.DataArrayornumpy.ndarray Vertex-centered values on
nVerticesor cell-centered values onnCells. Cell-centered values are averaged to vertices before plotting.- ax
matplotlib.axes.Axes, optional Axes on which to draw. By default, use the current axes.
- transform
cartopy.crs.CRS, optional Coordinate reference system of the input coordinates for Cartopy axes.
- lon_min, lon_max, lat_min, lat_max
float, optional Plot extent in degrees. Cross-dateline longitude windows are supported.
- auto_extent
bool, default: True If True and no explicit extent is supplied, infer the extent from valid vertices.
- extent_margin
float, default: 0.05 Fractional margin added to the automatically inferred extent.
- vertex_margin
float, default: 0.05 Fractional padding used when selecting dual polygons near the visible extent.
- global_plot
bool, default: False If True, draw a global extent centered on
center_lon.- center_lon
float, optional Longitude center used for wrapping. If None, infer it from the extent or valid vertices.
- input_radians
bool, default: True If True, MPAS longitude and latitude variables are interpreted as radians and converted to degrees.
- skip_large_lon_jump
bool, default: True If True, skip polygons with very large wrapped longitude spans.
- max_polygon_lon_span
float, default: 180.0 Maximum accepted wrapped polygon longitude span in degrees.
- cmap
strormatplotlib.colors.Colormap, optional Colormap used for polygon values.
- vmin, vmax
float, optional Color limits. If omitted, infer them from selected values.
- symmetric
bool, optional If True, infer symmetric color limits around zero. If None, default to True for vertex-dual plots.
- percentile
float, default: 98 Percentile used for automatic color-limit inference.
- edgecolor, linewidth
Polygon edge style passed to
matplotlib.collections.PolyCollection.- add_colorbar
bool, default: True If True, add a colorbar for the polygon collection.
- cbar_kwargs
dict, optional Keyword arguments passed to
Figure.colorbar.- title
str, optional Axes title. If None, use the data long name.
- xlabel, ylabel
str Axis labels used for plain Matplotlib axes.
- aspect
strorfloat, default: “auto” Aspect setting used for plain Matplotlib axes.
- cells_on_vertex_name
str MPAS variable giving neighboring cells for each vertex.
- lon_name_cell, lat_name_cell, lon_name_vertex, lat_name_vertex
str MPAS coordinate variable names.
- use_geometry_cache
bool, default: True If True, cache vertex-dual polygon geometry for repeated calls.
Returns
matplotlib.collections.PolyCollectionPolygon collection added to the axes.
- ds
- easyclimate.plot.mpas.plot_vertex_contour(ds, da, *, ax=None, lon_min=None, lon_max=None, lat_min=None, lat_max=None, auto_extent=True, extent_margin=0.05, contour_margin=0.05, global_plot=False, center_lon=None, levels=10, colors=None, linewidths=0.8, linestyles=None, cmap=None, vmin=None, vmax=None, symmetric=False, percentile=98, extend=None, max_triangle_edge=None, use_triangulation_cache=True, input_radians=True, transform=None, title=None, xlabel='Longitude', ylabel='Latitude', aspect='auto', lon_name_vertex='lonVertex', lat_name_vertex='latVertex')
Draw contour lines for MPAS vertex-centered scalar field.
Parameters
- ds
xarray.Dataset MPAS dataset containing vertex coordinate variables.
- da
xarray.DataArrayornumpy.ndarray Vertex-centered scalar values. The data must be one-dimensional on
nVerticesafter any time or vertical-level selection.- ax
matplotlib.axes.Axes, optional Axes on which to draw. By default, use the current axes.
- lon_min, lon_max, lat_min, lat_max
float, optional Plot extent in degrees. Cross-dateline longitude windows are supported.
- auto_extent
bool, default: True If True and no explicit extent is supplied, infer the extent from valid vertices.
- extent_margin
float, default: 0.05 Fractional margin added to the automatically inferred extent.
- contour_margin
float, default: 0.05 Fractional padding used when selecting source vertices for contouring.
- global_plot
bool, default: False If True, draw a global extent centered on
center_lon.- center_lon
float, optional Longitude center used for wrapping. If None, infer it from the extent or valid vertices.
- levels
intor array-like, default: 10 Number of contour levels, or explicit level values.
- colorscolor or
collections.abc.Sequenceof colors, optional Fixed line colors passed to
Axes.tricontour. If omitted, usecmap.- linewidths, linestyles
Contour line style options passed to
Axes.tricontour.- cmap
strormatplotlib.colors.Colormap, optional Colormap used when
colorsis not supplied.- vmin, vmax
float, optional Data limits used by contour levels and color mapping.
- symmetric
bool, default: False If True, infer symmetric limits around zero when
vminorvmaxis omitted.- percentile
float, default: 98 Percentile used for automatic data-limit inference.
- extend{“neither”, “both”, “min”, “max”}, optional
Contour extension mode. If None, infer it from data and levels.
- max_triangle_edge
float, optional Maximum accepted edge length for triangles. Longer triangles are masked.
- use_triangulation_cache
bool, default: True If True, cache the triangulation for repeated calls on the same mesh and extent.
- input_radians
bool, default: True If True, MPAS longitude and latitude variables are interpreted as radians and converted to degrees.
- transform
cartopy.crs.CRS, optional Coordinate reference system of the input coordinates for Cartopy axes.
- title
str, optional Axes title. If None, use the data long name.
- xlabel, ylabel
str Axis labels used for plain Matplotlib axes.
- aspect
strorfloat, default: “auto” Aspect setting used for plain Matplotlib axes.
- lon_name_vertex, lat_name_vertex
str MPAS vertex coordinate variable names.
Returns
matplotlib.contour.QuadContourSetContour set returned by
Axes.tricontour.
- ds
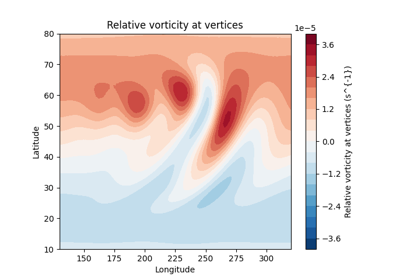
- easyclimate.plot.mpas.plot_vertex_contourf(ds, da, *, ax=None, lon_min=None, lon_max=None, lat_min=None, lat_max=None, auto_extent=True, extent_margin=0.05, contour_margin=0.05, global_plot=False, center_lon=None, levels=10, cmap=None, vmin=None, vmax=None, symmetric=False, percentile=98, extend=None, max_triangle_edge=None, use_triangulation_cache=True, input_radians=True, transform=None, add_colorbar=True, cbar_kwargs=None, title=None, xlabel='Longitude', ylabel='Latitude', aspect='auto', lon_name_vertex='lonVertex', lat_name_vertex='latVertex')
Draw filled contour for MPAS vertex-centered scalar field.
Parameters
- ds
xarray.Dataset MPAS dataset containing vertex coordinate variables.
- da
xarray.DataArrayornumpy.ndarray Vertex-centered scalar values. The data must be one-dimensional on
nVerticesafter any time or vertical-level selection.- ax
matplotlib.axes.Axes, optional Axes on which to draw. By default, use the current axes.
- lon_min, lon_max, lat_min, lat_max
float, optional Plot extent in degrees. Cross-dateline longitude windows are supported.
- auto_extent
bool, default: True If True and no explicit extent is supplied, infer the extent from valid vertices.
- extent_margin
float, default: 0.05 Fractional margin added to the automatically inferred extent.
- contour_margin
float, default: 0.05 Fractional padding used when selecting source vertices for contouring.
- global_plot
bool, default: False If True, draw a global extent centered on
center_lon.- center_lon
float, optional Longitude center used for wrapping. If None, infer it from the extent or valid vertices.
- levels
intor array-like, default: 10 Number of contour levels, or explicit level values.
- cmap
strormatplotlib.colors.Colormap, optional Colormap used for filled contours.
- vmin, vmax
float, optional Data limits used by contour levels and color mapping.
- symmetric
bool, default: False If True, infer symmetric limits around zero when
vminorvmaxis omitted.- percentile
float, default: 98 Percentile used for automatic data-limit inference.
- extend{“neither”, “both”, “min”, “max”}, optional
Colorbar extension mode. If None, infer it from data and levels.
- max_triangle_edge
float, optional Maximum accepted edge length for triangles. Longer triangles are masked.
- use_triangulation_cache
bool, default: True If True, cache the triangulation for repeated calls on the same mesh and extent.
- input_radians
bool, default: True If True, MPAS longitude and latitude variables are interpreted as radians and converted to degrees.
- transform
cartopy.crs.CRS, optional Coordinate reference system of the input coordinates for Cartopy axes.
- add_colorbar
bool, default: True If True, add a colorbar for the filled contour set.
- cbar_kwargs
dict, optional Keyword arguments passed to
Figure.colorbar.- title
str, optional Axes title. If None, use the data long name.
- xlabel, ylabel
str Axis labels used for plain Matplotlib axes.
- aspect
strorfloat, default: “auto” Aspect setting used for plain Matplotlib axes.
- lon_name_vertex, lat_name_vertex
str MPAS vertex coordinate variable names.
Returns
matplotlib.contour.QuadContourSetFilled contour set returned by
Axes.tricontourf.
- ds
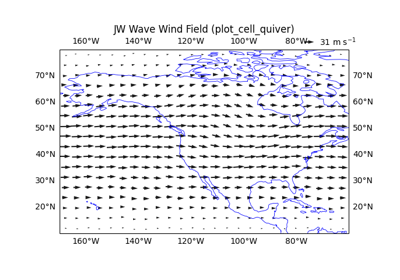
- easyclimate.plot.mpas.plot_cell_quiver(ds, u_da, v_da, *, ax=None, lon_min=None, lon_max=None, lat_min=None, lat_max=None, center_lon=None, input_radians=True, lon_name_cell='lonCell', lat_name_cell='latCell', nx_bins=35, ny_bins=20, thin_method='nearest_center', use_thinning_cache=True, add_quiverkey=True, quiverkey_value=None, quiverkey_label=None, quiverkey_x=0.88, quiverkey_y=1.04, transform=None, regrid_shape=None, regrid_global_epsilon=1e-06, title=None, **quiver_kwargs)
Plot cell-centered vector wind on MPAS mesh.
Parameters
- ds
xarray.Dataset MPAS dataset containing cell coordinate variables.
- u_da, v_da
xarray.DataArrayornumpy.ndarray Cell-centered zonal/eastward and meridional/northward vector components. Each input must be one-dimensional on
nCellsafter selection.- ax
matplotlib.axes.Axes, optional Axes on which to draw. By default, use the current axes.
- lon_min, lon_max, lat_min, lat_max
float Plot extent in degrees. These bounds are required so vector thinning is robust on variable-resolution meshes.
- center_lon
float, optional Longitude center used for wrapping. If None, infer it from the extent or valid cell centers.
- input_radians
bool, default: True If True, MPAS longitude and latitude variables are interpreted as radians and converted to degrees.
- lon_name_cell, lat_name_cell
str MPAS cell coordinate variable names.
- nx_bins, ny_bins
int, default: 35, 20 Number of longitude and latitude bins used to thin vectors.
- thin_method{“nearest_center”, “max_speed”, “mean”}, default: “nearest_center”
Rule used to choose or aggregate one vector per bin.
- use_thinning_cache
bool, default: True If True, cache coordinate-only bin metadata for repeated calls.
- add_quiverkey
bool, default: True If True, add a reference quiver key.
- quiverkey_value
float, optional Reference vector magnitude for the quiver key. If None, use the 75th percentile of thinned vector speeds.
- quiverkey_label
str, optional Label for the quiver key. If None, build a metres-per-second label from
quiverkey_value.- quiverkey_x, quiverkey_y
float, default: 0.88, 1.04 Quiver-key position in axes coordinates.
- transform
cartopy.crs.CRS, optional Coordinate reference system of the input coordinates for Cartopy axes.
- regrid_shape
intor (int,int) orNone, optional Regrid vectors onto a regular grid in the target map projection before plotting. This is only supported for Cartopy GeoAxes.
- regrid_global_epsilon
float, default: 1.0e-6 Small longitude shrink applied to full-width global regridding windows.
- title
str, optional Axes title. If None, use a default wind title.
- **quiver_kwargs
Additional keyword arguments passed to
Axes.quiver.
Returns
matplotlib.quiver.QuiverQuiver object returned by
Axes.quiver.
- ds
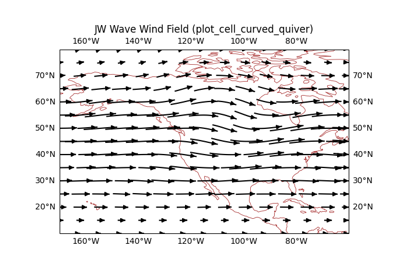
- easyclimate.plot.mpas.plot_cell_curved_quiver(ds, u_da, v_da, *, ax=None, lon_min=None, lon_max=None, lat_min=None, lat_max=None, center_lon=None, input_radians=True, lon_name_cell='lonCell', lat_name_cell='latCell', nx=160, ny=100, interpolation_padding=None, interpolation_padding_cells=2.0, min_valid_fraction=0.02, use_triangulation_cache=True, use_interp_weight_cache=True, transform=None, project_to_map=True, regrid_shape=None, regrid_global_epsilon=1e-06, density=1, linewidth=None, color=None, cmap=None, norm=None, arrowsize=1, arrowstyle='-|>', zorder=None, start_points=None, integration_direction='both', grains=15, broken_streamlines=True, ref_magnitude: float | None = None, ref_length: float | None = None, min_frac_length: float = 0.0, length_norm: Literal['reference', 'max', 'percentile'] = 'reference', mask_density: int | tuple[int, int] = 10, line_start_stride: int = 1, arrow_stride: int = 1, min_distance: float = 0.0, arrow_head_ratio: float = 1.0, arrow_position: float = 1.0, title=None) easyclimate.plot.modplot.CurvedQuiverplotSet
Plot MPAS cell-centered vector wind as curved quiver trajectories.
The MPAS cell-centered irregular vectors are first interpolated onto a regular grid, then drawn with the same curved-quiver engine used by
easyclimate.plot.curved_quiver_plot.curved_quiver().Parameters
- ds
xarray.Dataset MPAS dataset containing cell coordinate variables.
- u_da, v_da
xarray.DataArrayornumpy.ndarray Cell-centered zonal/eastward and meridional/northward vectors, 1D on nCells after selection.
- ax
matplotlib.axes.Axes, optional Axes on which to draw. By default, use the current axes.
- lon_min, lon_max, lat_min, lat_max
float Plot extent in degrees. These bounds are required to define the regular interpolation grid.
- center_lon
float, optional Longitude center used for wrapping. If None, infer it from the extent or valid cell centers.
- input_radians
bool, default: True If True, MPAS longitude and latitude variables are interpreted as radians and converted to degrees.
- lon_name_cell, lat_name_cell
str MPAS cell coordinate variable names.
- nx, ny
int, default: 160, 100 Number of longitude and latitude points in the regular interpolation grid.
- interpolation_padding
floator (float,float) orNone, optional Extra longitude/latitude degrees used only when selecting source cells for triangular interpolation. If None, padding is inferred from
interpolation_padding_cellsand the regular grid spacing.- interpolation_padding_cells
float, default: 2.0 Number of regular-grid cells used as automatic interpolation padding.
- min_valid_fraction
float, default: 0.02 Minimum fraction of valid interpolated grid points required before plotting.
- use_triangulation_cache, use_interp_weight_cache
bool, default: True If True, cache triangulation and interpolation weights for repeated calls on the same mesh and grid.
- transform
cartopy.crs.CRS, optional Coordinate reference system of the input coordinates for Cartopy axes.
- project_to_map
bool, default: True For Cartopy GeoAxes, transform the regular lon-lat grid and vector components to the target projection before drawing when the transformed grid remains rectilinear.
- regrid_shape
intor (int,int) orNone, optional Regrid vectors directly onto a regular grid in target projection coordinates. This is only supported for Cartopy GeoAxes and takes precedence over
project_to_map.- regrid_global_epsilon
float, default: 1.0e-6 Small longitude shrink applied to full-width global regridding windows.
- density, linewidth, color, cmap, norm, arrowsize, arrowstyle
Curved-quiver style options passed to
velovect.- zorder, start_points, integration_direction, grains, broken_streamlines
Curved-quiver trajectory options passed to
velovect.- ref_magnitude, ref_length, min_frac_length, length_norm
Options controlling how vector magnitude maps to curved-vector length.
- mask_density, line_start_stride, arrow_stride, min_distance
Options controlling seed-point density and collision masking.
- arrow_head_ratio, arrow_position
Arrow-head size and placement controls.
- title
str, optional Axes title. If None, use a default curved-quiver title.
Returns
easyclimate.plot.modplot.CurvedQuiverplotSetContainer with line and arrow artists returned by
velovect.
- ds
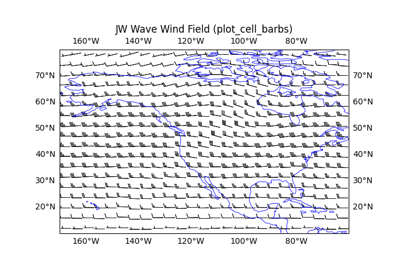
- easyclimate.plot.mpas.plot_cell_barbs(ds, u_da, v_da, *, ax=None, lon_min=None, lon_max=None, lat_min=None, lat_max=None, center_lon=None, input_radians=True, lon_name_cell='lonCell', lat_name_cell='latCell', nx_bins=35, ny_bins=20, thin_method='nearest_center', use_thinning_cache=True, transform=None, regrid_shape=None, regrid_global_epsilon=1e-06, title=None, **barbs_kwargs)
Plot cell-centered vector wind as wind barbs on an MPAS mesh.
Parameters
- ds
xarray.Dataset MPAS dataset containing cell coordinate variables.
- u_da, v_da
xarray.DataArrayornumpy.ndarray Cell-centered zonal/eastward and meridional/northward vectors, 1D on nCells after selection.
- ax
matplotlib.axes.Axes, optional Axes on which to draw. By default, use the current axes.
- lon_min, lon_max, lat_min, lat_max
float Plot extent in degrees. These bounds are required so vector thinning is robust on variable-resolution meshes.
- center_lon
float, optional Longitude center used for wrapping. If None, infer it from the extent or valid cell centers.
- input_radians
bool, default: True If True, MPAS longitude and latitude variables are interpreted as radians and converted to degrees.
- lon_name_cell, lat_name_cell
str MPAS cell coordinate variable names.
- nx_bins, ny_bins
int, default: 35, 20 Number of longitude and latitude bins used to thin vectors.
- thin_method{“nearest_center”, “max_speed”, “mean”}, default: “nearest_center”
Rule used to choose or aggregate one vector per bin.
- use_thinning_cache
bool, default: True If True, cache coordinate-only bin metadata for repeated calls.
- transform
cartopy.crs.CRS, optional Coordinate reference system of the input coordinates for Cartopy axes.
- regrid_shape
intor (int,int) orNone, optional Regrid vectors onto a regular grid in the target map projection before plotting. This is only supported for Cartopy GeoAxes.
- regrid_global_epsilon
float, default: 1.0e-6 Small longitude shrink applied to full-width global regridding windows.
- title
str, optional Axes title. If None, use a default wind-barb title.
- **barbs_kwargs
Additional keyword arguments passed to
Axes.barbs.
Returns
matplotlib.quiver.BarbsBarb container returned by
Axes.barbs.
- ds
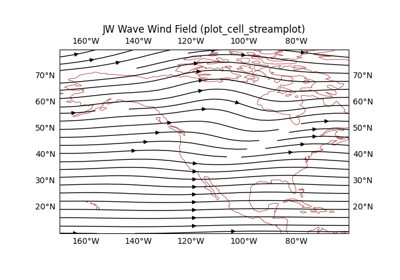
- easyclimate.plot.mpas.plot_cell_streamplot(ds, u_da, v_da, *, ax=None, lon_min=None, lon_max=None, lat_min=None, lat_max=None, center_lon=None, input_radians=True, lon_name_cell='lonCell', lat_name_cell='latCell', nx=160, ny=100, interpolation_padding=None, interpolation_padding_cells=2.0, min_valid_fraction=0.02, use_triangulation_cache=True, use_interp_weight_cache=True, transform=None, project_to_map=True, regrid_shape=None, regrid_global_epsilon=1e-06, title=None, **streamplot_kwargs)
Plot cell-centered vector wind as streamlines on an MPAS mesh.
The MPAS cell-centered irregular vectors are first interpolated onto a regular lon-lat grid using Matplotlib triangular linear interpolation, then passed to
Axes.streamplot/ Cartopy GeoAxesstreamplot.Parameters
- ds
xarray.Dataset MPAS dataset containing cell coordinate variables.
- u_da, v_da
xarray.DataArrayornumpy.ndarray Cell-centered zonal/eastward and meridional/northward vectors, 1D on nCells after selection.
- ax
matplotlib.axes.Axes, optional Axes on which to draw. By default, use the current axes.
- lon_min, lon_max, lat_min, lat_max
float Plot extent in degrees. These bounds are required to define the regular interpolation grid.
- center_lon
float, optional Longitude center used for wrapping. If None, infer it from the extent or valid cell centers.
- input_radians
bool, default: True If True, MPAS longitude and latitude variables are interpreted as radians and converted to degrees.
- lon_name_cell, lat_name_cell
str MPAS cell coordinate variable names.
- nx, ny
int, default: 160, 100 Number of longitude and latitude points in the regular interpolation grid.
- interpolation_padding
floator (float,float) orNone, optional Extra longitude/latitude degrees used only when selecting source cells for triangular interpolation. Padding keeps the requested output grid inside the interpolation hull, reducing blank margins near plot edges. If None, padding is inferred from
interpolation_padding_cellsand the regular grid spacing.- interpolation_padding_cells
float, optional Number of regular-grid cells used as automatic interpolation padding.
- project_to_map
bool, optional For Cartopy GeoAxes, transform the regular lon-lat grid and vector components to the target map projection before calling streamplot. This avoids Cartopy’s internal streamplot regridding from clipping a shifted PlateCarree window near the map edge.
- regrid_shape
intor (int,int) orNone, optional Regrid vectors onto a regular grid in the target map projection before plotting. This is only supported for Cartopy GeoAxes. If provided, this projection-grid path takes precedence over
project_to_map.- use_triangulation_cache
bool, optional Cache the geometry-only triangulation for repeated calls with the same dataset, extent, padding, and interpolation grid. This avoids rebuilding Qhull triangulation and TriFinder state when plotting multiple levels or time slices on the same MPAS mesh.
- use_interp_weight_cache
bool, optional Cache target-grid barycentric interpolation weights. This avoids repeated
LinearTriInterpolatorsetup and plane-coefficient calculations for repeated calls with the same geometry and interpolation grid.- transform
cartopy.crs.CRS, optional Coordinate reference system of the input coordinates for Cartopy axes.
- min_valid_fraction
float, default: 0.02 Minimum fraction of valid interpolated grid points required before plotting.
- title
str, optional Axes title. If None, use a default streamline title.
- **streamplot_kwargs
Additional keyword arguments passed to
Axes.streamplot.
Returns
matplotlib.streamplot.StreamplotSetStreamplot set returned by
Axes.streamplot.
- ds