Note
Go to the end to download the full example code.
MPAS Cell-centered wind barbs
This example draws MPAS cell-centered winds as meteorological barbs with
easyclimate.plot.mpas.plot_cell_barbs.
Wind barbs use the same regional subsetting and thinning controls as the MPAS quiver helper.
import xarray as xr
import numpy as np
import cartopy.crs as ccrs
import matplotlib.pyplot as plt
import easyclimate as ecl

from easyclimate.plot.mpas import plot_cell_barbs
Open MPAS output and select the reconstructed horizontal wind at one time and vertical level.
data = ecl.open_tutorial_dataset("mpas_JWwave_T10_nVertLevels10")
U = data.uReconstructZonal
V = data.uReconstructMeridional
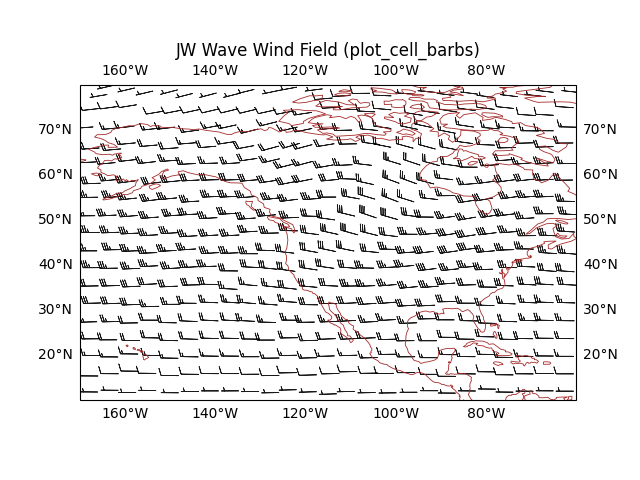
Draw wind barbs over a North Pacific domain using the vector nearest to each thinning-bin center.
fig, ax = plt.subplots(subplot_kw= {"projection": ccrs.PlateCarree(-120)})

cq = plot_cell_barbs(
    data,
    U,
    V,

    lon_min=190,
    lon_max=-60,
    lat_min=10,
    lat_max=80,

    nx_bins=25,
    ny_bins=18,

    thin_method="nearest_center",
)

ax.set_title("JW Wave Wind Field (plot_cell_barbs)")
ax.coastlines(resolution="110m", linewidth=0.6, color = "brown")
ax.gridlines(draw_labels=True, alpha = 0)
<cartopy.mpl.gridliner.Gridliner object at 0x73548a9bd5b0>
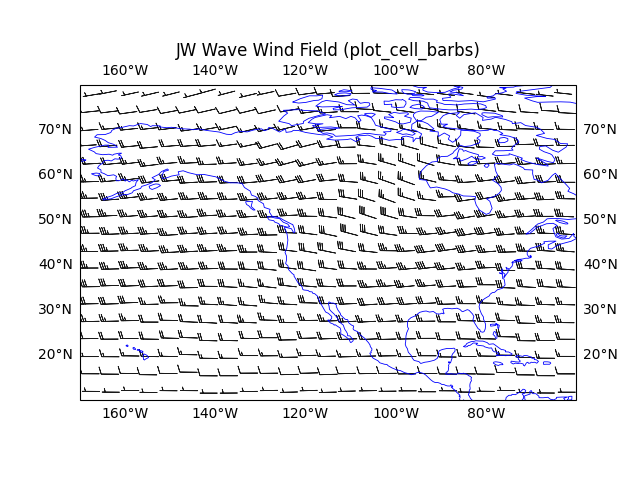
The mean thinning method averages winds inside each bin before drawing the
barb symbol.
fig, ax = plt.subplots(subplot_kw= {"projection": ccrs.PlateCarree(-120)})

cq = plot_cell_barbs(
    data,
    U,
    V,

    lon_min=190,
    lon_max=-60,
    lat_min=10,
    lat_max=80,

    nx_bins=25,
    ny_bins=18,

    thin_method="mean",
)

ax.set_title("JW Wave Wind Field (plot_cell_barbs)")
ax.coastlines(resolution="110m", linewidth=0.6, color = "b")
ax.gridlines(draw_labels=True, alpha = 0)
<cartopy.mpl.gridliner.Gridliner object at 0x73548a9bdd30>
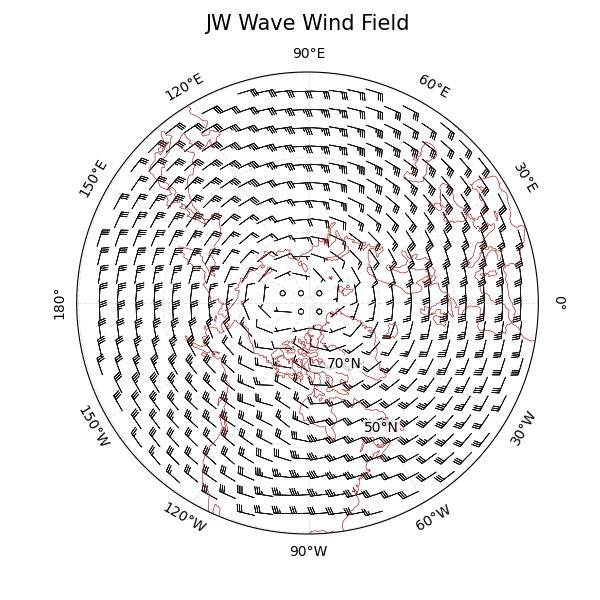
Polar projections can use regrid_shape to place barbs on the projected map
grid before rendering.
fig, ax = plt.subplots(
    figsize = (6, 6),
    subplot_kw={"projection": ccrs.NorthPolarStereo(central_longitude=-90)}
)

ax.coastlines(color="brown", linewidths=0.5)

cq = plot_cell_barbs(
    data,
    U,
    V,

    lon_min=0,
    lon_max=359,
    lat_min=30,
    lat_max=90,

    nx_bins=20,
    ny_bins=18,

    thin_method="nearest_center",
    title="",

    regrid_shape = 26,
)

gl, meta = ecl.plot.draw_polar_basemap(
    ax = ax,
    lon_step=30,
    lat_step=20,
    lat_range=[30, 90],
    draw_labels=True,
    gridlines_kwargs={"color": "grey", "alpha": 0.2, "linestyle": "--"},
    lat_label_lon=-60
)

ecl.plot.set_polar_title("JW Wave Wind Field", meta, size = 15)
Text(0.5, 1.0831890201695809, 'JW Wave Wind Field')
Total running time of the script: (0 minutes 5.252 seconds)