easyclimate.plot.mpas.voronoi_grid
Grid-line plots for MPAS Voronoi meshes.
Functions
|
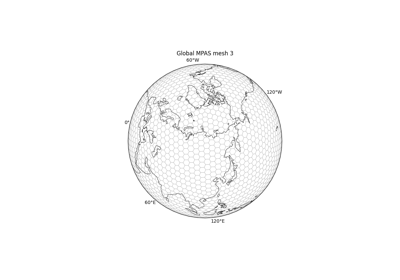
Plot MPAS Voronoi mesh edges. |
Module Contents
- easyclimate.plot.mpas.voronoi_grid.plot_voronoi_grid(data, verticesOnEdge='verticesOnEdge', lonVertex='lonVertex', latVertex='latVertex', lon_min=None, lon_max=None, lat_min=None, lat_max=None, ax=None, **linekwags)
Plot MPAS Voronoi mesh edges.
Parameters
- data
xarray.Dataset MPAS dataset containing
verticesOnEdge,lonVertex, andlatVertex. Used as the fallback source when these variables are not provided explicitly.- verticesOnEdge
str, optional Name of the edge-to-vertex connectivity variable using MPAS 1-based vertex indices.
- lonVertex, latVertex
str, optional Names of the vertex longitude and latitude variables in radians.
- lon_min, lon_max, lat_min, lat_max
float, optional Optional subset window in degrees. Cross-dateline longitude windows are supported.
- ax
matplotlib.axes.Axes, optional Axes on which to draw. By default, use the current axes.
- **linekwags
Additional keyword arguments passed to
matplotlib.collections.LineCollection.
Returns
matplotlib.collections.LineCollectionLine collection containing selected Voronoi mesh edges.
- data