easyclimate.plot.mpas.cell_streamplot
Cell-centered streamline plotting utilities for MPAS meshes.
Functions
|
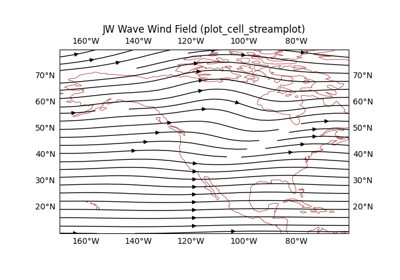
Plot cell-centered vector wind as streamlines on an MPAS mesh. |
Module Contents
- easyclimate.plot.mpas.cell_streamplot.plot_cell_streamplot(ds, u_da, v_da, *, ax=None, lon_min=None, lon_max=None, lat_min=None, lat_max=None, center_lon=None, input_radians=True, lon_name_cell='lonCell', lat_name_cell='latCell', nx=160, ny=100, interpolation_padding=None, interpolation_padding_cells=2.0, min_valid_fraction=0.02, use_triangulation_cache=True, use_interp_weight_cache=True, transform=None, project_to_map=True, regrid_shape=None, regrid_global_epsilon=1e-06, title=None, **streamplot_kwargs)
Plot cell-centered vector wind as streamlines on an MPAS mesh.
The MPAS cell-centered irregular vectors are first interpolated onto a regular lon-lat grid using Matplotlib triangular linear interpolation, then passed to
Axes.streamplot/ Cartopy GeoAxesstreamplot.Parameters
- ds
xarray.Dataset MPAS dataset containing cell coordinate variables.
- u_da, v_da
xarray.DataArrayornumpy.ndarray Cell-centered zonal/eastward and meridional/northward vectors, 1D on nCells after selection.
- ax
matplotlib.axes.Axes, optional Axes on which to draw. By default, use the current axes.
- lon_min, lon_max, lat_min, lat_max
float Plot extent in degrees. These bounds are required to define the regular interpolation grid.
- center_lon
float, optional Longitude center used for wrapping. If None, infer it from the extent or valid cell centers.
- input_radians
bool, default: True If True, MPAS longitude and latitude variables are interpreted as radians and converted to degrees.
- lon_name_cell, lat_name_cell
str MPAS cell coordinate variable names.
- nx, ny
int, default: 160, 100 Number of longitude and latitude points in the regular interpolation grid.
- interpolation_padding
floator (float,float) orNone, optional Extra longitude/latitude degrees used only when selecting source cells for triangular interpolation. Padding keeps the requested output grid inside the interpolation hull, reducing blank margins near plot edges. If None, padding is inferred from
interpolation_padding_cellsand the regular grid spacing.- interpolation_padding_cells
float, optional Number of regular-grid cells used as automatic interpolation padding.
- project_to_map
bool, optional For Cartopy GeoAxes, transform the regular lon-lat grid and vector components to the target map projection before calling streamplot. This avoids Cartopy’s internal streamplot regridding from clipping a shifted PlateCarree window near the map edge.
- regrid_shape
intor (int,int) orNone, optional Regrid vectors onto a regular grid in the target map projection before plotting. This is only supported for Cartopy GeoAxes. If provided, this projection-grid path takes precedence over
project_to_map.- use_triangulation_cache
bool, optional Cache the geometry-only triangulation for repeated calls with the same dataset, extent, padding, and interpolation grid. This avoids rebuilding Qhull triangulation and TriFinder state when plotting multiple levels or time slices on the same MPAS mesh.
- use_interp_weight_cache
bool, optional Cache target-grid barycentric interpolation weights. This avoids repeated
LinearTriInterpolatorsetup and plane-coefficient calculations for repeated calls with the same geometry and interpolation grid.- transform
cartopy.crs.CRS, optional Coordinate reference system of the input coordinates for Cartopy axes.
- min_valid_fraction
float, default: 0.02 Minimum fraction of valid interpolated grid points required before plotting.
- title
str, optional Axes title. If None, use a default streamline title.
- **streamplot_kwargs
Additional keyword arguments passed to
Axes.streamplot.
Returns
matplotlib.streamplot.StreamplotSetStreamplot set returned by
Axes.streamplot.
- ds