Note
Go to the end to download the full example code.
MPAS Cell-centered Voronoi plots
This example draws MPAS cell-centered scalar data on Voronoi polygons with
easyclimate.plot.mpas.plot_cell_voronoi.
Unlike contour plots, the Voronoi display preserves the native MPAS cell geometry and can optionally draw polygon edges.
import xarray as xr
import numpy as np
import cartopy.crs as ccrs
import matplotlib.pyplot as plt
import easyclimate as ecl

from easyclimate.plot.mpas import plot_cell_voronoi
Open MPAS output. The divergence variable is cell-centered and is plotted
on native MPAS cell polygons below.
data = ecl.open_tutorial_dataset("mpas_JWwave_T10_nVertLevels10")
data
Draw cell polygons on a plain Matplotlib axes for a broad regional window.
fig, ax = plt.subplots()

plot_cell_voronoi(
    data,
    data.divergence,

    vmax = 3e-6,
    vmin = -3e-6,

    ax = ax,
    lon_min=130,
    lon_max=320,
    lat_min=10,
    lat_max=80,

    cbar_kwargs = {'location': 'bottom', 'aspect': 60}
)
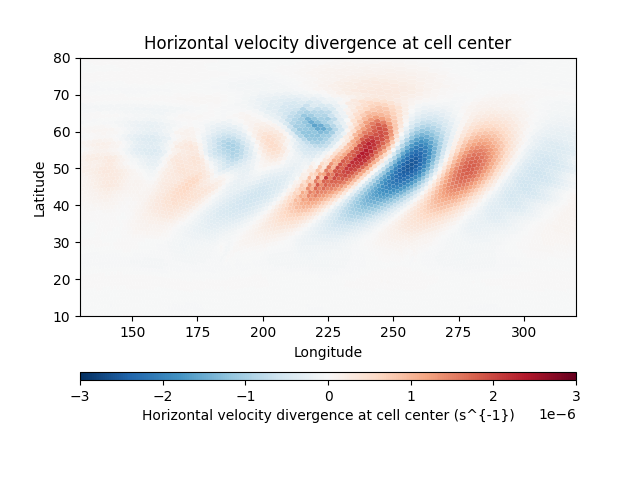
(<Axes: title={'center': 'Horizontal velocity divergence at cell center'}, xlabel='Longitude', ylabel='Latitude'>, <matplotlib.collections.PolyCollection object at 0x79225d9bd4c0>)
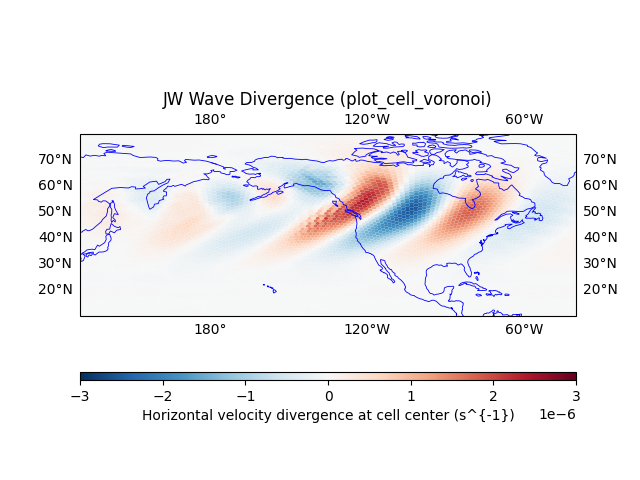
Draw the same field on a Cartopy projection with coastlines and gridlines.
fig, ax = plt.subplots(subplot_kw= {"projection": ccrs.PlateCarree(-120)})

plot_cell_voronoi(
    data,
    data.divergence,

    vmax = 3e-6,
    vmin = -3e-6,
    ax = ax,
    transform = ccrs.PlateCarree(),

    lon_min=130,
    lon_max=320,
    lat_min=10,
    lat_max=80,

    cbar_kwargs = {'location': 'bottom', 'aspect': 60}
)

ax.set_title("JW Wave Divergence (plot_cell_voronoi)")
ax.coastlines(resolution="110m", linewidth=0.6, color = "b")
ax.gridlines(draw_labels=True, alpha = 0)
<cartopy.mpl.gridliner.Gridliner object at 0x792251c6d550>
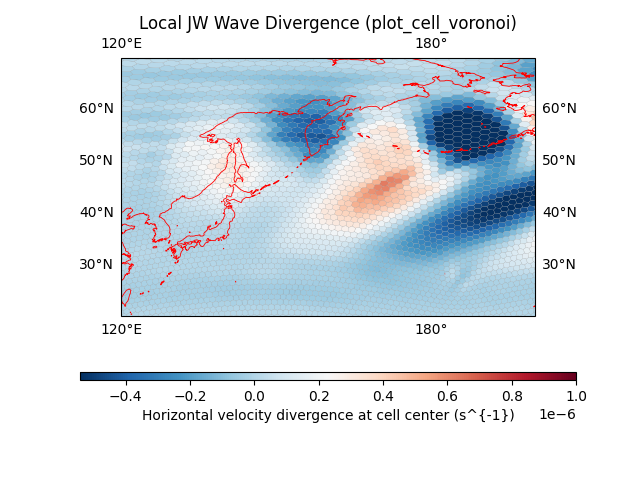
For regional inspection, polygon edges can be shown with a thin line style.
fig, ax = plt.subplots(subplot_kw= {"projection": ccrs.PlateCarree(160)})

plot_cell_voronoi(
    data,
    data.divergence,
    transform = ccrs.PlateCarree(),
    cmap = "RdBu_r",
    vmax = 1e-6,
    ax = ax,

    lon_min=120,
    lon_max=200,
    lat_min=20,
    lat_max=70,

    linewidth = 0.1,
    edgecolor="grey",

    cbar_kwargs = {'location': 'bottom', 'aspect': 60}
)

ax.set_title("Local JW Wave Divergence (plot_cell_voronoi)")
ax.coastlines(resolution="50m", linewidth=0.6, color = "r")
ax.gridlines(draw_labels=True, alpha = 0)
<cartopy.mpl.gridliner.Gridliner object at 0x79225309ec60>
Total running time of the script: (0 minutes 16.432 seconds)