easyclimate.plot.mpas.cell_quiver
Quiver plots for MPAS cell winds.
Functions
|
Plot cell-centered vector wind on MPAS mesh. |
Module Contents
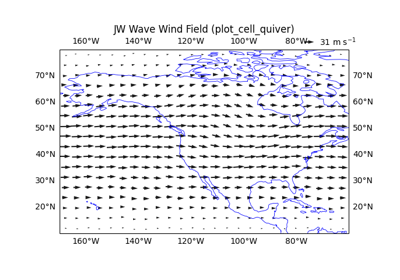
- easyclimate.plot.mpas.cell_quiver.plot_cell_quiver(ds, u_da, v_da, *, ax=None, lon_min=None, lon_max=None, lat_min=None, lat_max=None, center_lon=None, input_radians=True, lon_name_cell='lonCell', lat_name_cell='latCell', nx_bins=35, ny_bins=20, thin_method='nearest_center', use_thinning_cache=True, add_quiverkey=True, quiverkey_value=None, quiverkey_label=None, quiverkey_x=0.88, quiverkey_y=1.04, transform=None, regrid_shape=None, regrid_global_epsilon=1e-06, title=None, **quiver_kwargs)
Plot cell-centered vector wind on MPAS mesh.
Parameters
- ds
xarray.Dataset MPAS dataset containing cell coordinate variables.
- u_da, v_da
xarray.DataArrayornumpy.ndarray Cell-centered zonal/eastward and meridional/northward vector components. Each input must be one-dimensional on
nCellsafter selection.- ax
matplotlib.axes.Axes, optional Axes on which to draw. By default, use the current axes.
- lon_min, lon_max, lat_min, lat_max
float Plot extent in degrees. These bounds are required so vector thinning is robust on variable-resolution meshes.
- center_lon
float, optional Longitude center used for wrapping. If None, infer it from the extent or valid cell centers.
- input_radians
bool, default: True If True, MPAS longitude and latitude variables are interpreted as radians and converted to degrees.
- lon_name_cell, lat_name_cell
str MPAS cell coordinate variable names.
- nx_bins, ny_bins
int, default: 35, 20 Number of longitude and latitude bins used to thin vectors.
- thin_method{“nearest_center”, “max_speed”, “mean”}, default: “nearest_center”
Rule used to choose or aggregate one vector per bin.
- use_thinning_cache
bool, default: True If True, cache coordinate-only bin metadata for repeated calls.
- add_quiverkey
bool, default: True If True, add a reference quiver key.
- quiverkey_value
float, optional Reference vector magnitude for the quiver key. If None, use the 75th percentile of thinned vector speeds.
- quiverkey_label
str, optional Label for the quiver key. If None, build a metres-per-second label from
quiverkey_value.- quiverkey_x, quiverkey_y
float, default: 0.88, 1.04 Quiver-key position in axes coordinates.
- transform
cartopy.crs.CRS, optional Coordinate reference system of the input coordinates for Cartopy axes.
- regrid_shape
intor (int,int) orNone, optional Regrid vectors onto a regular grid in the target map projection before plotting. This is only supported for Cartopy GeoAxes.
- regrid_global_epsilon
float, default: 1.0e-6 Small longitude shrink applied to full-width global regridding windows.
- title
str, optional Axes title. If None, use a default wind title.
- **quiver_kwargs
Additional keyword arguments passed to
Axes.quiver.
Returns
matplotlib.quiver.QuiverQuiver object returned by
Axes.quiver.
- ds