easyclimate.plot.mpas.vertex_voronoi
Voronoi-style plots for MPAS vertices.
Functions
|
Plot MPAS vertex-centered scalar data on dual polygons. |
Module Contents
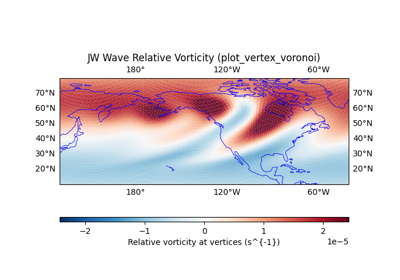
- easyclimate.plot.mpas.vertex_voronoi.plot_vertex_voronoi(ds, da, *, ax=None, transform=None, lon_min=None, lon_max=None, lat_min=None, lat_max=None, auto_extent=True, extent_margin=0.05, vertex_margin=0.05, global_plot=False, center_lon=None, input_radians=True, skip_large_lon_jump=True, max_polygon_lon_span=180.0, cmap=None, vmin=None, vmax=None, symmetric=None, percentile=98, edgecolor='none', linewidth=0.0, add_colorbar=True, cbar_kwargs=None, title=None, xlabel='Longitude', ylabel='Latitude', aspect='auto', cells_on_vertex_name='cellsOnVertex', lon_name_cell='lonCell', lat_name_cell='latCell', lon_name_vertex='lonVertex', lat_name_vertex='latVertex', use_geometry_cache=True)
Plot MPAS vertex-centered scalar data on dual polygons.
Each vertex value is drawn on the dual polygon formed by the surrounding cell centers. If
dais cell-centered with lengthnCells, values are first averaged to vertices usingcellsOnVertex.Parameters
- ds
xarray.Dataset MPAS dataset containing vertex, cell, and connectivity variables.
- da
xarray.DataArrayornumpy.ndarray Vertex-centered values on
nVerticesor cell-centered values onnCells. Cell-centered values are averaged to vertices before plotting.- ax
matplotlib.axes.Axes, optional Axes on which to draw. By default, use the current axes.
- transform
cartopy.crs.CRS, optional Coordinate reference system of the input coordinates for Cartopy axes.
- lon_min, lon_max, lat_min, lat_max
float, optional Plot extent in degrees. Cross-dateline longitude windows are supported.
- auto_extent
bool, default: True If True and no explicit extent is supplied, infer the extent from valid vertices.
- extent_margin
float, default: 0.05 Fractional margin added to the automatically inferred extent.
- vertex_margin
float, default: 0.05 Fractional padding used when selecting dual polygons near the visible extent.
- global_plot
bool, default: False If True, draw a global extent centered on
center_lon.- center_lon
float, optional Longitude center used for wrapping. If None, infer it from the extent or valid vertices.
- input_radians
bool, default: True If True, MPAS longitude and latitude variables are interpreted as radians and converted to degrees.
- skip_large_lon_jump
bool, default: True If True, skip polygons with very large wrapped longitude spans.
- max_polygon_lon_span
float, default: 180.0 Maximum accepted wrapped polygon longitude span in degrees.
- cmap
strormatplotlib.colors.Colormap, optional Colormap used for polygon values.
- vmin, vmax
float, optional Color limits. If omitted, infer them from selected values.
- symmetric
bool, optional If True, infer symmetric color limits around zero. If None, default to True for vertex-dual plots.
- percentile
float, default: 98 Percentile used for automatic color-limit inference.
- edgecolor, linewidth
Polygon edge style passed to
matplotlib.collections.PolyCollection.- add_colorbar
bool, default: True If True, add a colorbar for the polygon collection.
- cbar_kwargs
dict, optional Keyword arguments passed to
Figure.colorbar.- title
str, optional Axes title. If None, use the data long name.
- xlabel, ylabel
str Axis labels used for plain Matplotlib axes.
- aspect
strorfloat, default: “auto” Aspect setting used for plain Matplotlib axes.
- cells_on_vertex_name
str MPAS variable giving neighboring cells for each vertex.
- lon_name_cell, lat_name_cell, lon_name_vertex, lat_name_vertex
str MPAS coordinate variable names.
- use_geometry_cache
bool, default: True If True, cache vertex-dual polygon geometry for repeated calls.
Returns
matplotlib.collections.PolyCollectionPolygon collection added to the axes.
- ds