easyclimate.plot.mpas.vertex_contour
Contour plots for MPAS vertex data.
Functions
|
Draw filled contour for MPAS vertex-centered scalar field. |
|
Draw contour lines for MPAS vertex-centered scalar field. |
Module Contents
- easyclimate.plot.mpas.vertex_contour.plot_vertex_contourf(ds, da, *, ax=None, lon_min=None, lon_max=None, lat_min=None, lat_max=None, auto_extent=True, extent_margin=0.05, contour_margin=0.05, global_plot=False, center_lon=None, levels=10, cmap=None, vmin=None, vmax=None, symmetric=False, percentile=98, extend=None, max_triangle_edge=None, use_triangulation_cache=True, input_radians=True, transform=None, add_colorbar=True, cbar_kwargs=None, title=None, xlabel='Longitude', ylabel='Latitude', aspect='auto', lon_name_vertex='lonVertex', lat_name_vertex='latVertex')
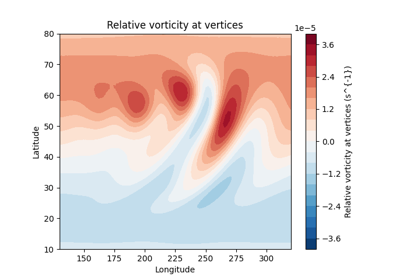
Draw filled contour for MPAS vertex-centered scalar field.
Parameters
- ds
xarray.Dataset MPAS dataset containing vertex coordinate variables.
- da
xarray.DataArrayornumpy.ndarray Vertex-centered scalar values. The data must be one-dimensional on
nVerticesafter any time or vertical-level selection.- ax
matplotlib.axes.Axes, optional Axes on which to draw. By default, use the current axes.
- lon_min, lon_max, lat_min, lat_max
float, optional Plot extent in degrees. Cross-dateline longitude windows are supported.
- auto_extent
bool, default: True If True and no explicit extent is supplied, infer the extent from valid vertices.
- extent_margin
float, default: 0.05 Fractional margin added to the automatically inferred extent.
- contour_margin
float, default: 0.05 Fractional padding used when selecting source vertices for contouring.
- global_plot
bool, default: False If True, draw a global extent centered on
center_lon.- center_lon
float, optional Longitude center used for wrapping. If None, infer it from the extent or valid vertices.
- levels
intor array-like, default: 10 Number of contour levels, or explicit level values.
- cmap
strormatplotlib.colors.Colormap, optional Colormap used for filled contours.
- vmin, vmax
float, optional Data limits used by contour levels and color mapping.
- symmetric
bool, default: False If True, infer symmetric limits around zero when
vminorvmaxis omitted.- percentile
float, default: 98 Percentile used for automatic data-limit inference.
- extend{“neither”, “both”, “min”, “max”}, optional
Colorbar extension mode. If None, infer it from data and levels.
- max_triangle_edge
float, optional Maximum accepted edge length for triangles. Longer triangles are masked.
- use_triangulation_cache
bool, default: True If True, cache the triangulation for repeated calls on the same mesh and extent.
- input_radians
bool, default: True If True, MPAS longitude and latitude variables are interpreted as radians and converted to degrees.
- transform
cartopy.crs.CRS, optional Coordinate reference system of the input coordinates for Cartopy axes.
- add_colorbar
bool, default: True If True, add a colorbar for the filled contour set.
- cbar_kwargs
dict, optional Keyword arguments passed to
Figure.colorbar.- title
str, optional Axes title. If None, use the data long name.
- xlabel, ylabel
str Axis labels used for plain Matplotlib axes.
- aspect
strorfloat, default: “auto” Aspect setting used for plain Matplotlib axes.
- lon_name_vertex, lat_name_vertex
str MPAS vertex coordinate variable names.
Returns
matplotlib.contour.QuadContourSetFilled contour set returned by
Axes.tricontourf.
- ds
- easyclimate.plot.mpas.vertex_contour.plot_vertex_contour(ds, da, *, ax=None, lon_min=None, lon_max=None, lat_min=None, lat_max=None, auto_extent=True, extent_margin=0.05, contour_margin=0.05, global_plot=False, center_lon=None, levels=10, colors=None, linewidths=0.8, linestyles=None, cmap=None, vmin=None, vmax=None, symmetric=False, percentile=98, extend=None, max_triangle_edge=None, use_triangulation_cache=True, input_radians=True, transform=None, title=None, xlabel='Longitude', ylabel='Latitude', aspect='auto', lon_name_vertex='lonVertex', lat_name_vertex='latVertex')
Draw contour lines for MPAS vertex-centered scalar field.
Parameters
- ds
xarray.Dataset MPAS dataset containing vertex coordinate variables.
- da
xarray.DataArrayornumpy.ndarray Vertex-centered scalar values. The data must be one-dimensional on
nVerticesafter any time or vertical-level selection.- ax
matplotlib.axes.Axes, optional Axes on which to draw. By default, use the current axes.
- lon_min, lon_max, lat_min, lat_max
float, optional Plot extent in degrees. Cross-dateline longitude windows are supported.
- auto_extent
bool, default: True If True and no explicit extent is supplied, infer the extent from valid vertices.
- extent_margin
float, default: 0.05 Fractional margin added to the automatically inferred extent.
- contour_margin
float, default: 0.05 Fractional padding used when selecting source vertices for contouring.
- global_plot
bool, default: False If True, draw a global extent centered on
center_lon.- center_lon
float, optional Longitude center used for wrapping. If None, infer it from the extent or valid vertices.
- levels
intor array-like, default: 10 Number of contour levels, or explicit level values.
- colorscolor or
collections.abc.Sequenceof colors, optional Fixed line colors passed to
Axes.tricontour. If omitted, usecmap.- linewidths, linestyles
Contour line style options passed to
Axes.tricontour.- cmap
strormatplotlib.colors.Colormap, optional Colormap used when
colorsis not supplied.- vmin, vmax
float, optional Data limits used by contour levels and color mapping.
- symmetric
bool, default: False If True, infer symmetric limits around zero when
vminorvmaxis omitted.- percentile
float, default: 98 Percentile used for automatic data-limit inference.
- extend{“neither”, “both”, “min”, “max”}, optional
Contour extension mode. If None, infer it from data and levels.
- max_triangle_edge
float, optional Maximum accepted edge length for triangles. Longer triangles are masked.
- use_triangulation_cache
bool, default: True If True, cache the triangulation for repeated calls on the same mesh and extent.
- input_radians
bool, default: True If True, MPAS longitude and latitude variables are interpreted as radians and converted to degrees.
- transform
cartopy.crs.CRS, optional Coordinate reference system of the input coordinates for Cartopy axes.
- title
str, optional Axes title. If None, use the data long name.
- xlabel, ylabel
str Axis labels used for plain Matplotlib axes.
- aspect
strorfloat, default: “auto” Aspect setting used for plain Matplotlib axes.
- lon_name_vertex, lat_name_vertex
str MPAS vertex coordinate variable names.
Returns
matplotlib.contour.QuadContourSetContour set returned by
Axes.tricontour.
- ds