easyclimate.plot.polar
Polar region mapping
Functions
|
Draw a polar stereographic circular basemap with optional gridlines and |
|
Add a title above a polar circular map using the layout metadata returned |
Module Contents
- easyclimate.plot.polar.draw_polar_basemap(*, lat_range: list, add_gridlines: bool = True, lon_step: float = None, lat_step: float = None, ax=None, draw_labels: bool = True, lat_label_lon: float | None = None, lon_label_lat: float | None = None, lon_label_pad_deg: float = -4.0, set_map_boundary_kwargs: dict | None = None, gridlines_kwargs: dict | None = None, lat_label_kwargs: dict | None = None, lon_label_kwargs: dict | None = None)
Draw a polar stereographic circular basemap with optional gridlines and manually positioned coordinate labels.
This function is designed for north and south polar stereographic maps. It first clips the map boundary into a circular polar view, then optionally adds longitude and latitude gridlines, and finally places readable manual latitude and longitude labels around the polar boundary.
Parameters
- lat_range: list[float] | tuple[float, float]
Latitude range used to define the circular polar boundary, such as
[50, 90]for the Northern Hemisphere or[-90, -50]for the Southern Hemisphere.- add_gridlines:
bool, default:True Whether to draw longitude and latitude gridlines.
- lon_step: float, optional
Interval of longitude gridlines and longitude labels in degrees. This parameter must be specified when add_gridlines=True or draw_labels=True.
- lat_step:
float, optional Interval of latitude gridlines and latitude labels in degrees. This parameter must be specified when add_gridlines=True or when manual latitude labels are enabled.
- ax: cartopy.mpl.geoaxes.GeoAxesSubplot, optional
Target axes with a polar stereographic projection. (uses current axes if None)
- draw_labels:
bool, default:True Whether to manually draw latitude and longitude labels.
- lat_label_lon:
float| None, optional Longitude at which latitude labels are placed.
- lon_label_lat:
float| None, optional Latitude at which longitude labels are placed. If not provided, it is inferred from the lower edge of lat_range plus lon_label_pad_deg.
- lon_label_pad_deg:
float, default:-4.0 Padding, in degrees latitude, used to shift longitude labels relative to the outer latitude boundary.
- set_map_boundary_kwargs:
dict| None, optional Additional keyword arguments passed to when constructing the circular boundary.
- north_pad
int A constant to be added to the second entry in lat_range. Use this if the northern edge of the plot is cut off. Defaults to 0.
- north_pad
- south_pad
int A constant to be subtracted from the first entry in lat_range. Use this if the southern edge of the plot is cut off. Defaults to 0.
- south_pad
- east_pad
int A constant to be added to the second entry in lon_range. Use this if the eastern edge of the plot is cut off. Defaults to 0.
- east_pad
- west_pad
int A constant to be subtracted from the first entry in lon_range. Use this if the western edge of the plot is cut off. Defaults to 0.
- west_pad
- gridlines_kwargs:
dict| None, optional Additional keyword arguments passed to
cartopy.mpl.geoaxes.GeoAxes.gridlineswhen drawing gridlines.- lat_label_kwargs:
dict| None, optional Additional text style options for latitude labels.
- lon_label_kwargs:
dict| None, optional Additional text style options for longitude labels.
Returns
- gl:
cartopy.mpl.gridliner.Gridlineror None The gridliner object returned by Cartopy. If add_gridlines=False,
Noneis returned.- meta:
dict Metadata dictionary describing the polar label layout. It can be passed directly to
set_polar_titleto help position titles above the circular map.
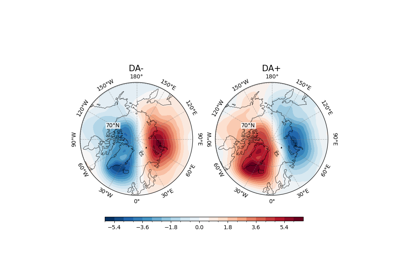
Arctic Dipole Anomaly (DA/AD) and Barents-Beaufort Oscillation (BBO)
Arctic Dipole Anomaly (DA/AD) and Barents-Beaufort Oscillation (BBO)

- easyclimate.plot.polar.set_polar_title(title: str, meta: dict, ax=None, *, loc: Literal['left', 'center', 'right'] = 'center', dy: float | None = None, xpad: float = 0.02, auto_dy_factor: float = 1.2, **text_kwargs)
Add a title above a polar circular map using the layout metadata returned by
draw_polar_basemap.This function estimates the uppermost position of manually placed longitude labels on a polar map, then places the title slightly above them so that the title does not overlap with the circular boundary labels.
Parameters
- title:
str Title text.
- meta:
dict Metadata dictionary returned by
draw_polar_basemap. It must at least contain lon_step and lon_label_lat.- ax: cartopy.mpl.geoaxes.GeoAxesSubplot
Polar stereographic axes on which the title will be drawn.
- loc: {“left”, “center”, “right”}, default:
"center" Horizontal alignment of the title.
- dy:
float| None, optional Vertical offset in axes coordinates relative to the topmost longitude label position. If
None, the offset is estimated automatically from the font size.- xpad:
float, default:0.02 Horizontal padding used when loc is
"left"or"right".- auto_dy_factor:
float, default:1.2 Multiplicative factor used when automatically converting font height into a safe vertical title offset.
- **text_kwargs
Additional keyword arguments passed to
matplotlib.axes.Axes.text.
Returns
matplotlib.text.TextThe created title text artist.
Note
If dy is
None, the function automatically computes a reasonable vertical offset based on the rendered font size, which is usually the most robust option for polar circular maps.- title: