easyclimate.plot.line
Bar plot for xarray dataset
Functions
|
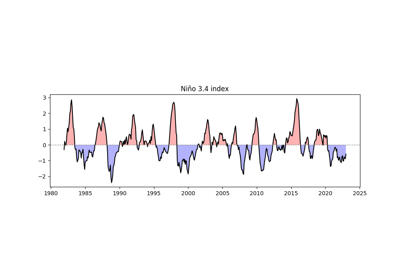
Plot a line chart with proper shading at threshold crossings. |
Module Contents
- easyclimate.plot.line.line_plot_with_threshold(da: xarray.DataArray, threshold: float = 0, pos_color: str = 'red', neg_color: str = 'blue', ax=None, line_plot: bool = True, fill_pos_plot: bool = True, fill_neg_plot: bool = True, line_kwargs=None, fill_kwargs=None) tuple
Plot a line chart with proper shading at threshold crossings.
Parameters:
- da
xarray.DataArray 1-dimensional data array
- threshold
float, optional Color separation threshold (default: 0)
- pos_color
str, optional Color for values ≥ threshold (default: ‘red’)
- neg_color
str, optional Color for values < threshold (default: ‘blue’)
- axmatplotlib axes, optional
Axes to plot on (default: current axes)
- line_kwargs
dict, optional Arguments for plt.plot
- fill_kwargs
dict, optional Arguments for plt.fill_between
Returns:
- tuple
(line plot, fill objects)
See also
matplotlib.lines.Line2D- da