Note
Go to the end to download the full example code.
MPAS Vertex-centered Voronoi plots
This example draws MPAS vertex-centered scalar data on the dual polygons around
each vertex with
easyclimate.plot.mpas.plot_vertex_voronoi.
If cell-centered data are supplied, the helper can average neighboring cell values to vertices before plotting.
import xarray as xr
import numpy as np
import cartopy.crs as ccrs
import matplotlib.pyplot as plt
import easyclimate as ecl

from easyclimate.plot.mpas import plot_vertex_voronoi
Open the sample MPAS output and use a selected relative-vorticity field for the vertex-based examples.
data = ecl.open_tutorial_dataset("mpas_JWwave_T10_nVertLevels10")
data
mpas_JWwave_T10_nVertLevels10.nc ━━━━━━━━ 100.0% • 2.3/2.3  • 24.2     • 0:00:00
                                                   MB         MB/s
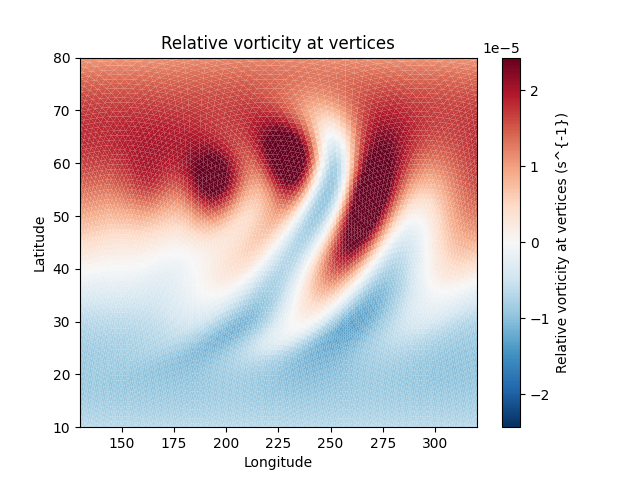
Draw vertex dual polygons over a broad region.
plot_vertex_voronoi(
    data,
    data.vorticity,
    lon_min=130,
    lon_max=320,
    lat_min=10,
    lat_max=80,
)
<matplotlib.collections.PolyCollection object at 0x70bf48f284d0>
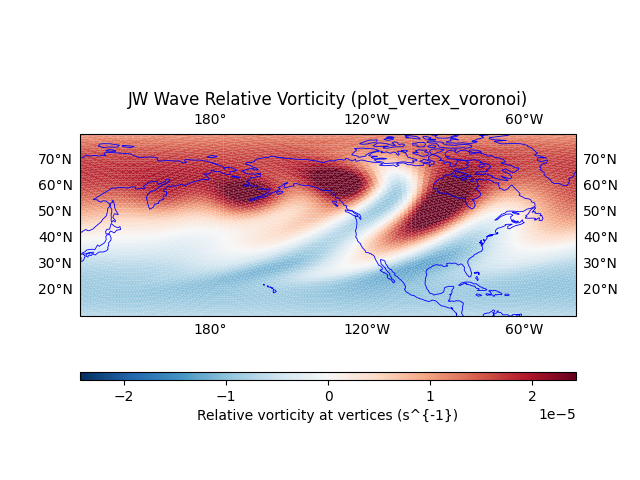
The helper can also draw on an existing Cartopy axes.
fig, ax = plt.subplots(subplot_kw= {"projection": ccrs.PlateCarree(-120)})

plot_vertex_voronoi(
    data,
    data.vorticity,

    ax = ax,
    transform = ccrs.PlateCarree(),

    lon_min=130,
    lon_max=320,
    lat_min=10,
    lat_max=80,

    cbar_kwargs = {'location': 'bottom', 'aspect': 60}
)

ax.set_title("JW Wave Relative Vorticity (plot_vertex_voronoi)")
ax.coastlines(resolution="110m", linewidth=0.6, color = "b")
ax.gridlines(draw_labels=True, alpha = 0)
<cartopy.mpl.gridliner.Gridliner object at 0x70bf3fdd5820>
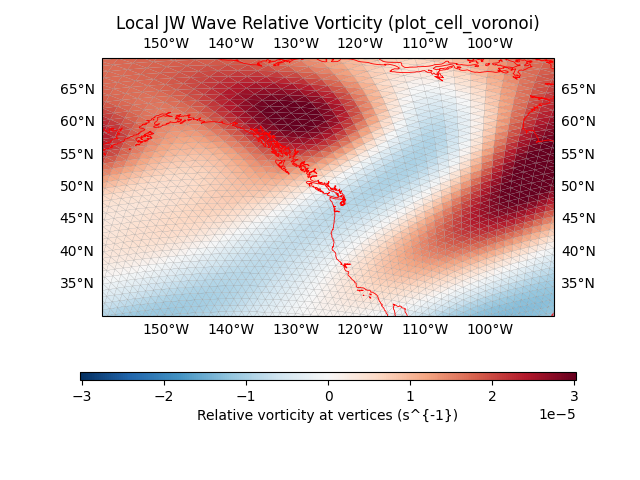
Show polygon edges in a smaller region to inspect the dual mesh structure.
fig, ax = plt.subplots(subplot_kw= {"projection": ccrs.PlateCarree(160)})

plot_vertex_voronoi(
    data,
    data.vorticity,

    transform = ccrs.PlateCarree(),
    ax = ax,

    lon_min=200,
    lon_max=270,
    lat_min=30,
    lat_max=70,

    linewidth = 0.1,
    edgecolor="grey",

    cbar_kwargs = {'location': 'bottom', 'aspect': 60}
)

ax.set_title("Local JW Wave Relative Vorticity (plot_cell_voronoi)")
ax.coastlines(resolution="50m", linewidth=0.6, color = "r")
ax.gridlines(draw_labels=True, alpha = 0)
<cartopy.mpl.gridliner.Gridliner object at 0x70bf3fe89940>
Total running time of the script: (0 minutes 22.041 seconds)