easyclimate.field.air_sea_interaction
Submodules
Functions
|
Calculate the Niño 1+2 index. |
|
Calculate the Niño 3 index. |
|
Calculate the Niño 3.4 index. |
|
Calculate the ONI (Oceanic Niño Index) index. |
|
Calculate the Niño 4 index. |
|
The calculation of monthly mean Indian Ocean Dipole (IOD) index (i.e., Dipole Mode Index; DMI) is constructed by following method: |
Sort the dimensions lat, lon in ascending order. |
|
Longitude conversion -180-180 to 0-360. |
|
|
Remove of the seasonal cycle means over the entire time range. |
|
Calculate ATL3 index. |
|
The calculation of monthly mean Atlantic Meridional Mode (AMM) index is constructed by following method: |
|
The calculation of monthly mean Indian Ocean Basin mode (IOBM) index is constructed by following method: |
|
The calculation of monthly mean PNA index using rotated empirical orthogonal functions (REOFs) method over the entire Northern Hemisphere: |
|
The calculation of monthly mean Pacific Decadal Oscillation (PDO) index using empirical orthogonal functions (EOFs) method over the North Pacific basin. |
Package Contents
- easyclimate.field.air_sea_interaction.calc_index_nino1and2(sst_monthly_data: xarray.DataArray | xarray.Dataset, time_range: slice = slice(None, None), lat_dim: str = 'lat', lon_dim: str = 'lon', time_dim: str = 'time', normalized: bool = False) xarray.DataArray | xarray.Dataset
Calculate the Niño 1+2 index.
The Niño 1+2 region (0°-10°S, 90°W-80°W) is the smallest and eastern-most of the Niño SST regions, and corresponds with the region of coastal South America where El Niño was first recognized by the local populations. This index tends to have the largest variance of the Niño SST indices.
Parameters
- sst_monthly_data:
xarray.DataArray. The monthly sea surface temperature (SST) dataset.
- time_range:
slice, default: slice(None, None). The time range of seasonal cycle means to be calculated. The default value is the entire time range.
- lat_dim:
str, default: lat. Latitude coordinate dimension name. By default extracting is applied over the lat dimension.
- lon_dim:
str, default: lon. Longitude coordinate dimension name. By default extracting is applied over the lon dimension.
- time_dim:
str, default: time. The time coordinate dimension name.
- normalized:
bool, default False, optional. Whether to standardize the index based on standard deviation over time_range.
Returns
Niño 1+2 index.
Reference
Trenberth, Kevin & National Center for Atmospheric Research Staff (Eds). Last modified 2023-07-25 “The Climate Data Guide: Nino SST Indices (Nino 1+2, 3, 3.4, 4; ONI and TNI).” Retrieved from https://climatedataguide.ucar.edu/climate-data/nino-sst-indices-nino-12-3-34-4-oni-and-tni on 2023-11-12.
El Niño Index Dashboard. Website: https://psl.noaa.gov/enso/dashboard.html
- sst_monthly_data:
- easyclimate.field.air_sea_interaction.calc_index_nino3(sst_monthly_data: xarray.DataArray | xarray.Dataset, time_range: slice = slice(None, None), lat_dim: str = 'lat', lon_dim: str = 'lon', time_dim: str = 'time', normalized: bool = False) xarray.DataArray | xarray.Dataset
Calculate the Niño 3 index.
This region (5°N-5°S, 150°W-90°W) was once the primary focus for monitoring and predicting El Niño, but researchers later learned that the key region for coupled ocean-atmosphere interactions for ENSO lies further west (Trenberth, 1997). Hence, the Niño 3.4 and ONI became favored for defining El Niño and La Niña events.
Parameters
- sst_monthly_data:
xarray.DataArray. The monthly sea surface temperature (SST) dataset.
- time_range:
slice, default: slice(None, None). The time range of seasonal cycle means to be calculated. The default value is the entire time range.
- lat_dim:
str, default: lat. Latitude coordinate dimension name. By default extracting is applied over the lat dimension.
- lon_dim:
str, default: lon. Longitude coordinate dimension name. By default extracting is applied over the lon dimension.
- time_dim:
str, default: time. The time coordinate dimension name.
- normalized:
bool, default False, optional. Whether to standardize the index based on standard deviation over time_range.
Returns
Niño 3 index.
Reference
Trenberth, Kevin & National Center for Atmospheric Research Staff (Eds). Last modified 2023-07-25 “The Climate Data Guide: Nino SST Indices (Nino 1+2, 3, 3.4, 4; ONI and TNI).” Retrieved from https://climatedataguide.ucar.edu/climate-data/nino-sst-indices-nino-12-3-34-4-oni-and-tni on 2023-11-12.
El Niño Index Dashboard. Website: https://psl.noaa.gov/enso/dashboard.html
Trenberth, K. E., 1997: The Definition of El Niño. Bull. Amer. Meteor. Soc., 78, 2771–2778, https://doi.org/10.1175/1520-0477(1997)078<2771:TDOENO>2.0.CO;2.
- sst_monthly_data:
- easyclimate.field.air_sea_interaction.calc_index_nino34(sst_monthly_data: xarray.DataArray | xarray.Dataset, time_range: slice = slice(None, None), lat_dim: str = 'lat', lon_dim: str = 'lon', running_mean=5, time_dim: str = 'time', normalized: bool = False) xarray.DataArray | xarray.Dataset
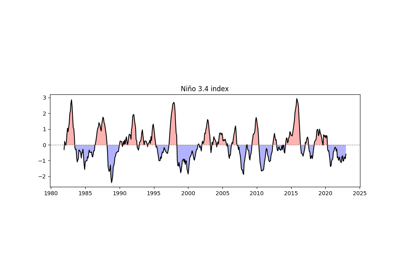
Calculate the Niño 3.4 index.
The Niño 3.4 (5°N-5°S, 170°W-120°W) anomalies may be thought of as representing the average equatorial SSTs across the Pacific from about the dateline to the South American coast. The Niño 3.4 index typically uses a 5-month running mean, and El Niño or La Niña events are defined when the Niño 3.4 SSTs exceed +/- 0.4℃ for a period of six months or more.
Parameters
- sst_monthly_data:
xarray.DataArray. The monthly sea surface temperature (SST) dataset.
- time_range:
slice, default: slice(None, None). The time range of seasonal cycle means to be calculated. The default value is the entire time range.
- lat_dim:
str, default: lat. Latitude coordinate dimension name. By default extracting is applied over the lat dimension.
- lon_dim:
str, default: lon. Longitude coordinate dimension name. By default extracting is applied over the lon dimension.
- running_mean:
int, default: 5. Running mean value. If running_mean is None or 0, it will not perform running average operation.
- time_dim:
str, default: time. The time coordinate dimension name.
- normalized:
bool, default False, optional. Whether to standardize the index based on standard deviation over time_range.
Returns
Niño 3.4 index.
Reference
Trenberth, Kevin & National Center for Atmospheric Research Staff (Eds). Last modified 2023-07-25 “The Climate Data Guide: Nino SST Indices (Nino 1+2, 3, 3.4, 4; ONI and TNI).” Retrieved from https://climatedataguide.ucar.edu/climate-data/nino-sst-indices-nino-12-3-34-4-oni-and-tni on 2023-11-12.
El Niño Index Dashboard. Website: https://psl.noaa.gov/enso/dashboard.html
- sst_monthly_data:
- easyclimate.field.air_sea_interaction.calc_index_OMI(sst_monthly_data: xarray.DataArray | xarray.Dataset, time_range: slice = slice(None, None), lat_dim: str = 'lat', lon_dim: str = 'lon', running_mean=3, time_dim: str = 'time', normalized: bool = False) xarray.DataArray | xarray.Dataset
Calculate the ONI (Oceanic Niño Index) index.
The ONI (5°N-5°S, 170°W-120°W) uses the same region as the Niño 3.4 index. The ONI uses a 3-month running mean, and to be classified as a full-fledged El Niño or La Niña, the anomalies must exceed +0.5℃ or -0.5℃ for at least five consecutive months. This is the operational definition used by NOAA.
Parameters
- sst_monthly_data:
xarray.DataArray. The monthly sea surface temperature (SST) dataset.
- time_range:
slice, default: slice(None, None). The time range of seasonal cycle means to be calculated. The default value is the entire time range.
- lat_dim:
str, default: lat. Latitude coordinate dimension name. By default extracting is applied over the lat dimension.
- lon_dim:
str, default: lon. Longitude coordinate dimension name. By default extracting is applied over the lon dimension.
- running_mean:
int, default: 3. Running mean value. If running_mean is None or 0, it will not perform running average operation.
- time_dim:
str, default: time. The time coordinate dimension name.
- normalized:
bool, default False, optional. Whether to standardize the index based on standard deviation over time_range.
Returns
ONI index.
Reference
Trenberth, Kevin & National Center for Atmospheric Research Staff (Eds). Last modified 2023-07-25 “The Climate Data Guide: Nino SST Indices (Nino 1+2, 3, 3.4, 4; ONI and TNI).” Retrieved from https://climatedataguide.ucar.edu/climate-data/nino-sst-indices-nino-12-3-34-4-oni-and-tni on 2023-11-12.
El Niño Index Dashboard. Website: https://psl.noaa.gov/enso/dashboard.html
- sst_monthly_data:
- easyclimate.field.air_sea_interaction.calc_index_nino4(sst_monthly_data: xarray.DataArray | xarray.Dataset, time_range: slice = slice(None, None), lat_dim: str = 'lat', lon_dim: str = 'lon', time_dim: str = 'time', normalized: bool = False) xarray.DataArray | xarray.Dataset
Calculate the Niño 4 index.
The Niño 4 index (5°N-5°S, 160°E-150°W) captures SST anomalies in the central equatorial Pacific. This region tends to have less variance than the other Niño regions.
Parameters
- sst_monthly_data:
xarray.DataArray. The monthly sea surface temperature (SST) dataset.
- time_range:
slice, default: slice(None, None). The time range of seasonal cycle means to be calculated. The default value is the entire time range.
- lat_dim:
str, default: lat. Latitude coordinate dimension name. By default extracting is applied over the lat dimension.
- lon_dim:
str, default: lon. Longitude coordinate dimension name. By default extracting is applied over the lon dimension.
- time_dim:
str, default: time. The time coordinate dimension name.
- normalized:
bool, default False, optional. Whether to standardize the index based on standard deviation over time_range.
Returns
Niño 4 index.
Reference
Trenberth, Kevin & National Center for Atmospheric Research Staff (Eds). Last modified 2023-07-25 “The Climate Data Guide: Nino SST Indices (Nino 1+2, 3, 3.4, 4; ONI and TNI).” Retrieved from https://climatedataguide.ucar.edu/climate-data/nino-sst-indices-nino-12-3-34-4-oni-and-tni on 2023-11-12.
El Niño Index Dashboard. Website: https://psl.noaa.gov/enso/dashboard.html
- sst_monthly_data:
- easyclimate.field.air_sea_interaction.calc_index_IOD_Saji_1999(sst_monthly_data: xarray.DataArray, time_range: slice = slice(None, None), lon_dim: str = 'lon', lat_dim: str = 'lat', time_dim: str = 'time', normalized: bool = False) xarray.DataArray
The calculation of monthly mean Indian Ocean Dipole (IOD) index (i.e., Dipole Mode Index; DMI) is constructed by following method:
The difference in SST anomaly between the tropical western Indian Ocean (50°E-70°E, 10°S-10°N) and the tropical south-eastern Indian Ocean (90°E-110°E, 10°S-Equator).
Parameters
- sst_monthly_data:
xarray.DataArray. The monthly sea surface temperature (SST) dataset.
- time_range:
slice, default: slice(None, None). The time range of seasonal cycle means to be calculated. The default value is the entire time range.
- lon_dim:
str, default: lon. Longitude coordinate dimension name. By default extracting is applied over the lon dimension.
- lat_dim:
str, default: lat. Latitude coordinate dimension name. By default extracting is applied over the lat dimension.
- time_dim:
str, default: time. The time coordinate dimension name.
- normalized:
bool, default True, optional. Whether to standardize the index based on standard deviation over time_range.
Returns
The monthly mean IOD index (
xarray.DataArray).Reference
- sst_monthly_data:
- easyclimate.field.air_sea_interaction.sort_ascending_latlon_coordinates(data: xarray.DataArray | xarray.Dataset, lat_dim: str = 'lat', lon_dim: str = 'lon') xarray.DataArray | xarray.Dataset
Sort the dimensions lat, lon in ascending order.
- easyclimate.field.air_sea_interaction.transfer_xarray_lon_from180TO360(data_input: xarray.DataArray | xarray.Dataset, lon_dim: str = 'lon') xarray.DataArray | xarray.Dataset
Longitude conversion -180-180 to 0-360.
Parameters
- data_input
xarray.DataArrayorxarray.Dataset The spatio-temporal data to be calculated.
- lon_dim:
str, default: lon. Longitude coordinate dimension name. By default extracting is applied over the lon dimension.
Returns
xarray.DataArrayorxarray.Dataset.See also
transfer_xarray_lon_from360TO180- data_input
- easyclimate.field.air_sea_interaction.remove_seasonal_cycle_mean(data_input: xarray.DataArray | xarray.Dataset, dim: str = 'time', time_range: slice = slice(None, None)) xarray.DataArray
Remove of the seasonal cycle means over the entire time range.
Parameters
- data_input
xarray.DataArrayorxarray.Dataset. The data of
xarray.DataArrayto be calculated.
Caution
data_input must be monthly data.
Returns
Example(s) related to the function
- data_input
- easyclimate.field.air_sea_interaction.calc_index_ATL3(sst_monthly_data: xarray.DataArray | xarray.Dataset, time_range: slice = slice(None, None), lat_dim: str = 'lat', lon_dim: str = 'lon', time_dim: str = 'time', normalized: bool = False) xarray.DataArray | xarray.Dataset
Calculate ATL3 index.
In some years, the cold tongue formation in summer is weak, leading to warm SST anomalies in the cold tongue region. This is what is called an Atlantic Niño. One way to gauge the strength of these events is to calculate the area average of SST in the cold tongue region, defined as 20°W to 0° and 3°S to 3°N. This is called the ATL3 index.
Parameters
- sst_monthly_data:
xarray.DataArray. The monthly sea surface temperature (SST) dataset.
- time_range:
slice, default: slice(None, None). The time range of seasonal cycle means to be calculated. The default value is the entire time range.
- lat_dim:
str, default: lat. Latitude coordinate dimension name. By default extracting is applied over the lat dimension.
- lon_dim:
str, default: lon. Longitude coordinate dimension name. By default extracting is applied over the lon dimension.
- time_dim:
str, default: time. The time coordinate dimension name.
- normalized:
bool, default False, optional. Whether to standardize the index based on standard deviation over time_range.
Returns
ATL3 index.
Reference
- sst_monthly_data:
- easyclimate.field.air_sea_interaction.calc_index_AMM_Doi_2009(sst_monthly_data: xarray.DataArray, time_range: slice = slice(None, None), lon_dim: str = 'lon', lat_dim: str = 'lat', time_dim: str = 'time', normalized: bool = False) xarray.DataArray
The calculation of monthly mean Atlantic Meridional Mode (AMM) index is constructed by following method:
The difference difference between the northern index (SSTA in 5–15°N, 50–20°W) and the southern index (SSTA in 5–15°S, 20°W–10°E). See Fig. 7 in Doi et al. 2009.
Parameters
- sst_monthly_data:
xarray.DataArray. The monthly sea surface temperature (SST) dataset.
- time_range:
slice, default: slice(None, None). The time range of seasonal cycle means to be calculated. The default value is the entire time range.
- lon_dim:
str, default: lon. Longitude coordinate dimension name. By default extracting is applied over the lon dimension.
- lat_dim:
str, default: lat. Latitude coordinate dimension name. By default extracting is applied over the lat dimension.
- time_dim:
str, default: time. The time coordinate dimension name.
- normalized:
bool, default True, optional. Whether to standardize the index based on standard deviation over time_range.
Returns
The monthly mean AMM index (
xarray.DataArray).Reference
- sst_monthly_data:
- easyclimate.field.air_sea_interaction.calc_index_IOBM_1point(sst_monthly_data: xarray.DataArray, time_range: slice = slice(None, None), lon_range: slice = slice(40, 110), lon_dim: str = 'lon', lat_dim: str = 'lat', time_dim: str = 'time', normalized: bool = False) xarray.DataArray
The calculation of monthly mean Indian Ocean Basin mode (IOBM) index is constructed by following method:
The SSTA averaged over the tropical Indian Ocean (40°E-100°E, 20°S-20°N) or (40°E-110°E, 20°S-20°N).
Parameters
- sst_monthly_data:
xarray.DataArray. The monthly sea surface temperature (SST) dataset.
- time_range:
slice, default: slice(None, None). The time range of seasonal cycle means to be calculated. The default value is the entire time range.
- lon_range:
slice, default: slice(40, 110). The range of longitude to calculate the IOBM index. Common choices include slice(40, 110) and slice(40, 100).
- lon_dim:
str, default: lon. Longitude coordinate dimension name. By default extracting is applied over the lon dimension.
- lat_dim:
str, default: lat. Latitude coordinate dimension name. By default extracting is applied over the lat dimension.
- time_dim:
str, default: time. The time coordinate dimension name.
- normalized:
bool, default True, optional. Whether to standardize the index based on standard deviation over time_range.
Returns
The monthly mean IOBM index (
xarray.DataArray).Reference
- (40°E-100°E, 20°S-20°N)
- (40°E-110°E, 20°S-20°N)
- sst_monthly_data:
- easyclimate.field.air_sea_interaction.calc_index_IOBM_EOF1(sst_monthly_data: xarray.DataArray, time_range: slice = slice(None, None), lon_range: slice = slice(40, 110), lon_dim: str = 'lon', lat_dim: str = 'lat', time_dim: str = 'time', random_state: int | None = None, solver: Literal['auto', 'full', 'randomized'] = 'auto', solver_kwargs: dict = {}, normalized: bool = True) xarray.DataArray
The calculation of monthly mean PNA index using rotated empirical orthogonal functions (REOFs) method over the entire Northern Hemisphere:
Parameters
- sst_monthly_data:
xarray.DataArray. The monthly sea surface temperature (SST) dataset.
- time_range:
slice, default: slice(None, None). The time range of seasonal cycle means to be calculated. The default value is the entire time range.
- lon_range:
slice, default: slice(40, 110). The range of longitude to calculate the IOBM index. Common choices include slice(40, 110) and slice(40, 100).
- lon_dim:
str, default: lon. Longitude coordinate dimension name. By default extracting is applied over the lon dimension.
- lat_dim:
str, default: lat. Latitude coordinate dimension name. By default extracting is applied over the lat dimension.
- time_dim:
str, default: time. The time coordinate dimension name.
- random_state:
int, default None. Seed for the random number generator.
- solver: {“auto”, “full”, “randomized”}, default: “auto”.
Solver to use for the EOFs computation.
- solver_kwargs:
dict, default {}. Additional keyword arguments to be passed to the EOFs solver.
- normalized:
bool, default True, optional. Whether to standardize the index based on standard deviation over time_range.
Returns
The monthly mean IOBM index (
xarray.DataArray).Reference
- (40°E-100°E, 20°S-20°N)
- (40°E-110°E, 20°S-20°N)
See also
- sst_monthly_data:
- easyclimate.field.air_sea_interaction.calc_index_PDO_EOF1(sst_monthly_data: xarray.DataArray, time_range: slice = slice(None, None), lon_dim: str = 'lon', lat_dim: str = 'lat', time_dim: str = 'time', random_state: int | None = None, solver: Literal['auto', 'full', 'randomized'] = 'auto', solver_kwargs: dict = {}, normalized: bool = True, detrend_spatial: bool = True) xarray.DataArray
The calculation of monthly mean Pacific Decadal Oscillation (PDO) index using empirical orthogonal functions (EOFs) method over the North Pacific basin.
Parameters
- sst_monthly_data:
xarray.DataArray. The monthly sea surface temperature (SST) dataset.
- time_range:
slice, default: slice(None, None). The time range of seasonal cycle means to be calculated. The default value is the entire time range.
- lon_dim:
str, default: lon. Longitude coordinate dimension name. By default extracting is applied over the lon dimension.
- lat_dim:
str, default: lat. Latitude coordinate dimension name. By default extracting is applied over the lat dimension.
- time_dim:
str, default: time. The time coordinate dimension name.
- random_state:
int, default None. Seed for the random number generator.
- solver: {“auto”, “full”, “randomized”}, default: “auto”.
Solver to use for the EOFs computation.
- solver_kwargs:
dict, default {}. Additional keyword arguments to be passed to the EOFs solver.
- normalized:
bool, default True, optional. Whether to standardize the index based on standard deviation over time_range.
- normalized:
bool, default True, optional. Remove linear trend along time coordinate dimension from data.
Returns
The monthly mean PDO index (
xarray.DataArray).Reference
Zhang, Y., Wallace, J. M., & Battisti, D. S. (1997). ENSO-like Interdecadal Variability: 1900–93. Journal of Climate, 10(5), 1004-1020. https://journals.ametsoc.org/view/journals/clim/10/5/1520-0442_1997_010_1004_eliv_2.0.co_2.xml
Mantua, N. J., Hare, S. R., Zhang, Y., Wallace, J. M., & Francis, R. C. (1997). A Pacific Interdecadal Climate Oscillation with Impacts on Salmon Production*. Bulletin of the American Meteorological Society, 78(6), 1069-1080. https://journals.ametsoc.org/view/journals/bams/78/6/1520-0477_1997_078_1069_apicow_2_0_co_2.xml
Mantua, N.J., Hare, S.R. The Pacific Decadal Oscillation. Journal of Oceanography 58, 35–44 (2002). https://doi.org/10.1023/A:1015820616384
Trenberth, K.E. and Fasullo, J.T. (2013), An apparent hiatus in global warming?. Earth’s Future, 1: 19-32. https://doi.org/10.1002/2013EF000165
Deser, Clara &, Trenberth, Kevin & National Center for Atmospheric Research Staff (Eds). Last modified 2025-04-29 “The Climate Data Guide: Pacific Decadal Oscillation (PDO): Definition and Indices.” Retrieved from https://climatedataguide.ucar.edu/climate-data/pacific-decadal-oscillation-pdo-definition-and-indices
Schneider, D. P., C. Deser, J. Fasullo, and K. E. Trenberth (2013), Climate Data Guide Spurs Discovery and Understanding, Eos Trans. AGU, 94(13), 121. https://doi.org/10.1002/2013EO130001
See also
- sst_monthly_data: